ASTRAL ready to run away!After months of corrections, corporate action and consolidation Astral is finally ready for new highs!
ASTRAL trade ideas

Tech.analysis shows Astral LTD has the potential for longThe technical analysis indicates that the stock has the potential to reach the target price, given the current market conditions and the breakout pattern. Traders should closely monitor the stock's price movements and adjust their positions accordingly to maximize profits and minimize losses.
Astral Ltd stock has recently experienced a significant breakout after a poll and flag pattern formation. The stock is currently trading in the range of 2085-2120, providing a potential entry point for traders looking to capitalize on the upward momentum.
The breakout suggests a strong bullish sentiment in the market, with the stock likely to continue its upward trajectory. With a stop-loss set at 1875, traders can manage their risk effectively while aiming for a target price of 2600.

Bullish Pattern in ASTRALAfter a long consolidation, stock can give breakout from 2 bullish chart patterns. Ascending Triangle and W pattern are both considered to be bullish patterns. Closing above 2130 with good volumes can give a good upside momentum. Keeping it on Radar.

Astral - Flag breakoutGo long
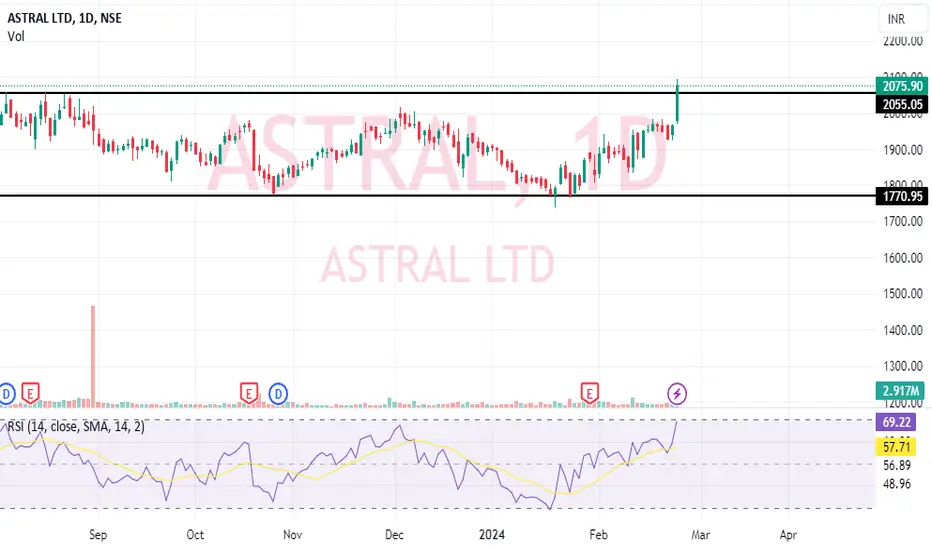
Flag breakout
Breakout level - 2056
Buy @ CMP - 2080
T1/ T2/ T3 - 2200/ 2400/ 2500
SL - 1990
Time - 3-6 weeks

Flag FormationOnce the price breaks above the green line, higher possibilities as per flag pattern open up.
SL is redline dotted line, which should be trailed for best results.
--- --- ---
Learn the ability to be happy unconditionally.
This way the markets can't take that happiness away from you.
- Yvan Byeajee

buy abvbe 2050 for tgt 2111ONLY FOR EDUCATION PERPOSE resistance breakout with volume and long considlition

Astral LTD Analysis on 3 mar 24Astral LTD Analysis on 3 mar 24
possible breakout pole and flag pattern
keep stop loss 1700 (on a closing basis)
add 50% quantity now
add more on deep till 1950
target 2200 - 2300 - 2400
pole and flag length target 2620 and above

ASTRAL : Strong BreakoutAstral :
Channel breakout &
Flag Pole Breakout
Stay long with good support at 2000

Astral breakout--Breakout and retest
--Dravas bos breakout with good volume
--Target 2500
Disclaimer:
- The view expressed here is my personal view
- Any decision you take, you need to take responsibility for the same
- It's your hard earned money. Treat it wisely
- Trade / Invest keeping in mind your trading style, goals and objectives, time horizon & risk tolerance
-- Do your own analysis and consult your financial adviser if needed

ASTRAL[WEEKLY]Astral trading very important level. And price near upside trendline. If it breaks and close above the trendline then we go for long. ONLY EDUCATIONAL PURPOSE

Amazing breakout on Weekly / Daily Timeframe - ASTRALCheckout an amazing breakout happened in the stock in Weekly timeframe, macroscopically seen in Daily timeframe. Having a great favour that the stock might be bullish expecting a staggering returns of minimum 25% TGT. IMPORTANT BREAKOUT LEVELS ARE ALWAYS RESPEECTED!
NOTE for learners: Place the breakout levels as per the chart shared and track it yourself to get amazed!!
#No complicated chart patterns
#No big big indicators
#No Excel sheet or number magics
TRADE IDEA: WAIT FOR THE STOCK TO BREAKOUT IN LOWER TIMEFRAME AND RETRACE IF NEEDED. SL IS NEARER SUPPORT ZONE IN Daily TIMEFRAME.
PS: No new Nifty500 script can escape from me when making a breakout. :-)

Astral Ltd: Cup & Handle PatternAstral Ltd: Cup & Handle Pattern
56 % upside potential
Levels mentioned on chart & given targets seems achievable.
Plan your trade accordingly.
Views are for ‘’EDUCATIONAL PURPOSE ONLY’’,trade at your own risk.
"Trade what you see, Not what You Think"
Happy Trading(:)

ASTRAL break out tgt 2350-2430Astral Ltd. Breakout of Flag Pattern
1. Narrowing Bollinger Bands on Weekly chart
2. Price moving on upper Bollinger Bands on Daily Chart
3. can be a Good buy on Dips and dips only for a target of 2350- 2430 in near term
Disclaimer: I am not an expert I just share interesting charts here for educational purpose and not to be taken as buy/sell recommendation. Please seek expert opinion before investing and trading as trading/ investing in market is subject to market risks. I do not hold any position in the stock as on date but I may look to buy on dips with my own Risk Reward matrix.

breakout levelastral is trading at breakout level 2000..... data support also PCR is 0.48 currecnt data...

ASTRAL F&P BREAKOUT WCBASTRAL breaking f&p pattern
#weekly chart basis
with huge voume
trading at ATH
#target1 2200 #target2 2500
EDUCATIONAL IDEA

ASTRAL - Ichimoku Breakout📈 Stock Name - Astral Poly Technik Limited
🌐 Ichimoku Cloud Setup:
1️⃣ Today's close is above the Conversion Line.
2️⃣ Future Kumo is Turning Bullish.
3️⃣ Chikou span is slanting upwards.
All these parameters are shouting BULLISH at the Current Market Price and even more bullishness anticipated AFTER crossing 2080.
🚨 Disclaimer: This is not a Buy or Sell recommendation. It's for educational purposes and a guiding light to learn trading in the market.
#CloudTrading
#IchimokuCloud
#IchimokuFollowers
#Ichimokuexpert
Excited about this analysis? Share your thoughts in the comments below!
👍 Like, Share, and Subscribe for daily market insights! 🚀
#StockAnalysis #MarketWatch #TradingEducation #ichimoku

#Astral is getting the heat of the moment # SuperChartzKey Level:
Support: 1950
Resistance: 2099, 2199, 2250
Key Drivers:
Astral Poly Technik Ltd, founded in 1996, is a major player in India's plumbing and adhesive industries. It pioneered lead-free PVC pipes and expanded into adhesives through acquisitions. The company's diverse product range includes plumbing systems, adhesives, water tanks, faucets, and paints. With manufacturing facilities in multiple countries and a robust distribution network, it has a strong presence both domestically and internationally. Recent expansions into faucets, sanitary ware, and paints highlight its growth strategy. Astral Poly Technik Ltd maintains a focus on brand promotion and plans for continued expansion, supported by healthy financials and strategic acquisitions.

ASTRAL | BEAUTIFUL POLE + FLAG! | RR-1:3A strong pole & a flag consolidation is formed on Astral. Price hovering around the flag resistance indicates a breakout is highly probable. Price consolidating in All time High territory, so no resistance to the upside.
Disclaimer: This is NOT a trade recommendation but only my analysis. Please do your own research before trading.

ASTRAL Good Conslidation Stock NSE:ASTRAL Is Good Consolidation Stock Twi things Happen Breakout the Resistance we get clear Move on Upside or if Breks the Support we get Some Fall add to Your Watchlist it's take some time

Astral ready to rock n rollInside candle bar trade + Triangle breakout + Weekly Bullish candle
Small trade:
Entry: 1968.80
Target: 2073.40
SL: 1948.50
(Time: 1-2 Week)
Big target: 1968.80
Target: 2290
SL: 1808.50
(1 month)
View for educational purposes

Astral ready for an upmoveOn shorter time frame an upside of 21% possible from here.
If it breaks 2051 level uptrend can be confirmed.
On longer time frame reverse head and shoulder/ cup with handle or rounding bottom pattern is seen.
On short time frame there is a chance of bullish rectangule pattern if it breaks 2051.
Note: only for educational purpose

ASTRAL - Bullish Consolidation with VolumesNSE: ASTRAL is closing with a bullish consolidation candle supported with volumes.
Today's volumes and candlestick formation indicates strong demand and stock should move to previous swing highs in the coming days.
The stock has reversed at key support area which is indicating demand.
One can look for a 11% to 16% gain on deployed capital in this swing trade.
The view is to be discarded in the event of the stock breaking previous swing low.
#NSEindia #Trading #StockMarketindia #Tradingview #SwingTrade
