BANKNIFTY trade ideas

Banknifty Intraday Analysis for 06th February 2025NSE:BANKNIFTY
Index closed near 50345 level and Maximum Call and Put Writing near CMP as below in February Month contract:
Call Writing
51000 Strike – 9.92 Lakh
50000 Strike – 8.14 Lakh 50500 Strike – 6.19 Lakh
Put Writing
49000 Strike – 13.48 Lakh
50000 Strike – 9.89 Lakh
49500 Strike – 6.22 Lakh
Index has resistance near 50700 – 50800 range and if index crosses and sustains above this level then may reach near 51400 – 51500 range.
Index has immediate support near 49700 - 49600 range and if this support is broken then index may tank near 48900 - 48800 range.

BankNifty levels - Feb 07, 2025Utilizing the support and resistance levels of BankNifty, along with the 5-minute timeframe candlesticks and VWAP, can enhance the precision of trade entries and exits on or near these levels. It is crucial to recognize that these levels are not static, and they undergo alterations as market dynamics evolve.
The dashed lines on the chart indicate the reaction levels, serving as additional points of significance. Furthermore, take note of the response at the levels of the High, Low, and Close values from the day prior.
We trust that this information proves valuable to you.
* If you found the idea appealing, kindly tap the Boost icon located below the chart. We encourage you to share your thoughts and comments regarding it.
Wishing you successful trading endeavors!


BANKNIFTY Levels February 6, 2025BANKNIFTY Levels for Today
Here are the today's BANKNIFTY Levels for intraday. Based on market movement, these levels can act as support, resistance or both.
Please consider these levels only if there is movement in index and 15m candle sustains at the given levels.
The SL (Stop loss) for each BUY trade should be the previous RED candle below the given level. Similarly, the SL (Stop loss) for each SELL trade should be the previous GREEN candle above the given level.
Note: This idea and these levels are only for learning and educational purpose.
Your likes /boosts gives us motivation for continued leaning and sharing ideas.

Use of Macd in trading (basic-to-advance)Moving average convergence/divergence (MACD) is a technical indicator to help investors identify entry points for buying or selling. The MACD line is calculated by subtracting the 26-period exponential moving average (EMA) from the 12-period EMA. The signal line is a nine-period EMA of the MACD line.
The standard and most widely used settings for the MACD Indicator are 12, 26, and 9. These represent the 12-day EMA (fast line), the 26-day EMA (slow line), and the 9-day EMA (signal line). However, some traders adjust these to shorter periods (like 8, 17, and 9) for day trading to capture faster market movements

Bank nifty trades and targets for - 6/2/25Hello Everyone. The market was in a very tight range the previous day. Let the resistance or support range break with 15-minute candle before going for any trades. If the market opens flat then we can see continuation of trend. If it opens gap up then we need to see the resistance level to break before looking for CE trades. If it opens gap down then look for PE trades after support zone is broken. Let the market settle in first 15 to 100 minutes then look for directional trades.

Nifty & Bank Nifty - FIIs sold again. Was 1 day buying a trap? FII sold almost double the amount today of what they bought yesterday. Was this their trap for the upcoming Nifty's expiry session on tomorrow? And what about Bank Nifty - Is that any better placed over Nifty?
Let's get to know all of it through this video.

Banknifty Intraday Analysis for 05th February 2025NSE:BANKNIFTY
Index closed near 50160 level and Maximum Call and Put Writing near CMP as below in February Month contract:
Call Writing
50000 Strike – 10.63 Lakh
51000 Strike – 9.92 Lakh 51500 Strike – 6.21 Lakh
Put Writing
49000 Strike – 12.83 Lakh
50000 Strike – 9.35 Lakh
49500 Strike – 5.80 Lakh
Index has resistance near 50600 – 50700 range and if index crosses and sustains above this level then may reach near 51200 – 51300 range.
Index has immediate support near 49500 - 49400 range and if this support is broken then index may tank near 48900 - 48800 range.

BankNifty levels - Feb 06, 2025Utilizing the support and resistance levels of BankNifty, along with the 5-minute timeframe candlesticks and VWAP, can enhance the precision of trade entries and exits on or near these levels. It is crucial to recognize that these levels are not static, and they undergo alterations as market dynamics evolve.
The dashed lines on the chart indicate the reaction levels, serving as additional points of significance. Furthermore, take note of the response at the levels of the High, Low, and Close values from the day prior.
We trust that this information proves valuable to you.
* If you found the idea appealing, kindly tap the Boost icon located below the chart. We encourage you to share your thoughts and comments regarding it.
Wishing you successful trading endeavors!

Is this a valid breakout ? Banknifty Plan 04/02/2025 My plan is to short tomorrow as we are at key resistance zone. ( Consider the points below ).
Look for price to test key resistance zones
Wait for a failed breakout or rejection candle
Enter short after confirmation (such as a bearish engulfing or candle close below support)
Use a trailing stop once the trade moves in your favor
Short at or near resistance, exit at support
Place stop-loss just above recent highs or resistance level
Consider a multi-timeframe analysis: Watch 5-min, 15-min, and hourly charts
Monitor global cues and sentiment (if Bank Nifty is correlating with global market weakness)
Set realistic targets: 200 points, then reassess
Scale in once the move gains momentum
Avoid taking trades if market is too choppy or indecisive
Use caution if price is too close to major support
Consider volume: Ensure breakout is supported by increasing volume to confirm the move
If market conditions change, exit early to lock in profits

Banknifty buy holding from 49150 upside Target on chart givenHow to take trades using Harmonic pattern projection Trade setup is explained below :-
1st D point : 0% is recent top or bottom.
2nd D Point : 13.5% is work as trailing SL of buy or sell trade if hit then we have to book profit
.If price goes below 13.5% then early or risky traders can reversal trade ,
Safe traders can wait for 27% levels break
Targets :
Target T1 is 27.3% if you are taken entry from 13.5% if taken entry from 27.3 then Target T1: 38.2 % level is our 1st Target
( 38.2% if also a reversal zone so if price reverse then we can make fresh entry also).
T2: 50% level is our 2nd Target
T3: 61.8% to 65 % is our 3rd Target
( This is also reversal zone so we have to book profit at this area and if break then take fresh entry with SL of 2nd Target 50% .)
Next Targets are 78.6 % , 88.9 % 100% , 113.5 % , 127.2% , 141.5% and 161.8% to 165%.
161.8 to 165% if profit booking area so book full profit and wait for reversal.
How to take reversal trade :
If price going upside/ downside then then buy or sell levels appear on Chart ( Automatically show when price reach any reversal zone of harmonic projection pattern based .
After showing reversal levels wait for confirmation until 13.5 % or 27 .6 % level not break if break then exit from current buy / sell trade and take fresh reverse trade buy/ sell .
Trailing SL:
After reach 1st Target trail SL to just above or below cost ( for example we are holding sell trade from 100 1st Target 110 hit then move trailing sl to 104-105 and move SL as price move upside or Downside)
Blue Line is 1st support/ Resistance
Green line is 2nd support/ resistance
Red line is 3rd Support/ resistance

BANKNIFTY Levels February 5, 2025
BANKNIFTY Levels for Today
Here are the today's BANKNIFTY Levels for intraday. Based on market movement, these levels can act as support, resistance or both.
Please consider these levels only if there is movement in index and 15m candle sustains at the given levels.
The SL (Stop loss) for each BUY trade should be the previous RED candle below the given level. Similarly, the SL (Stop loss) for each SELL trade should be the previous GREEN candle above the given level.
Note: This idea and these levels are only for learning and educational purpose.
Your likes /boosts gives us motivation for continued leaning and sharing ideas.

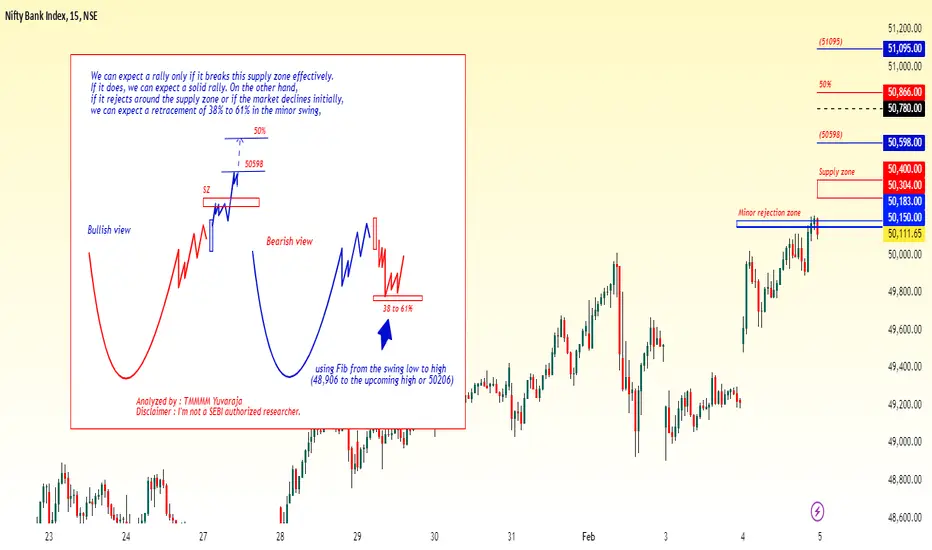
#Banknifty directions and levels for February 5th:In the previous session, Bank Nifty had a solid rally, suggesting further continuation. However, We can expect a rally only if it effectively breaks through this supply zone. If it does, we can anticipate a solid rally. However, if it rejects around the supply zone or if the market declines initially, we can expect a minimum retracement of 38% to 61% in the minor swing, using the Fibonacci levels from the swing low to the upcoming high (from 48,906 to the anticipated high)
Bank nifty trades and targets - 5/2/25Hello Everyone. The market was in a bullish mode today. If the market opens flat then we can see continuation of trend. If it opens gap up then we need to see the resistance level to break before looking for CE trades. If it opens gap down then look for PE trades after support zone is broken. Let the market settle in first 15 to 30 minutes then look for directional trades. Book profits every 100 points as we are getting very few trending moves.

Database Trading Part 2Database trading is a method of using data to make better decisions in the market. It involves using data analysis to improve profits and avoid costly mistakes.
How does database trading work?
Data collection: Data is collected from various sources, such as stock exchanges, third-party financial data vendors, investment banks, and hedge funds
Data analysis: The data is analyzed to identify patterns and trends
Decision making: The data analysis is used to make decisions about trading, such as when to buy or sell
Execution: The decisions are executed by machines or humans
Benefits of database trading Helps improve profits, Helps avoid costly mistakes, and Helps navigate the markets.
Examples of trading strategies
Day trading
Involves making many trades in a single day to profit from short-term price changes
Algorithmic trading
Involves using computer programs to execute trades based on predefined rules
Event trading
Involves profiting from short-term price movements triggered by specific events
Position trading
Involves holding positions for an extended period to profit from price movements

Database Trading Part 1Database trading is a method of using data to make better decisions in the market. It involves using data analysis to improve profits and avoid costly mistakes.
How does database trading work?
Data collection: Data is collected from various sources, such as stock exchanges, third-party financial data vendors, investment banks, and hedge funds
Data analysis: The data is analyzed to identify patterns and trends
Decision making: The data analysis is used to make decisions about trading, such as when to buy or sell
Execution: The decisions are executed by machines or humans
Benefits of database trading Helps improve profits, Helps avoid costly mistakes, and Helps navigate the markets.
Examples of trading strategies
Day trading
Involves making many trades in a single day to profit from short-term price changes
Algorithmic trading
Involves using computer programs to execute trades based on predefined rules
Event trading
Involves profiting from short-term price movements triggered by specific events
Position trading
Involves holding positions for an extended period to profit from price movements

Database Trading Part 5Trading data is a sub-category of financial market data. It provides real-time information about stock and market prices as well as historical trends for assets such as equities, fixed-income products, currencies and derivatives.
How does database trading work?
Data collection: Data is collected from various sources, such as stock exchanges, third-party financial data vendors, investment banks, and hedge funds
Data analysis: The data is analyzed to identify patterns and trends
Decision making: The data analysis is used to make decisions about trading, such as when to buy or sell
Execution: The decisions are executed by machines or humans

Use of RSI in tradingThe Relative Strength Index (RSI) is a technical indicator that helps traders assess the momentum of an asset's price. It's used to identify overbought and oversold market conditions, and to provide buy and sell signals
How to use RSI
Identify overbought and oversold conditions
RSI values above 70 indicate overbought conditions, while values below 30 indicate oversold conditions.
Confirm trends
Use the RSI to validate trends and trend reversals. For example, a downward trend is confirmed when the RSI crosses from above 50 to below 50.
Provide buy and sell signals
Use the RSI to determine when to enter and exit positions. For example, low RSI levels indicate oversold conditions, which may generate a potential buy signal.
Combine with other indicators
Use the RSI with other technical indicators to identify market trends and confirm signals. For example, you can combine RSI with moving averages to identify strong assets in uptrends

Macd divergenceThe indicator is calculated by subtracting a 26-period Exponential Moving Average from the 12-period moving average. There is also a histogram available on the indicator which can also be used as a divergence indicator. As a result, you will then see the MACD line, which shows as an indicator below the price chart.
For daily charts, many traders find the default MACD settings (12, 26, 9) to be very effective. This timeframe captures the broader market trends and helps filter out market noise. Combine MACD with other indicators like RSI or Bollinger Bands when analyzing a 1-day chart for a more comprehensive market view

RSI basic to advanceAn RSI divergence occurs when the indicator and price begin to reach different levels, indicating a change in momentum that precedes a change in price direction. For example, a bullish divergence occurs when the security makes a lower low but the indicator forms a higher low.
Low RSI levels, typically below 30 (red line), indicate oversold conditions—generating a potential buy signal. Conversely, high RSI levels, typically above 70 (green line), indicate overbought conditions—generating a potential sell signal

BankNifty is in value buy zone Banknifty is deep value buy zone. In near future this can go beyond 55000 and we are trading near 48000. INR depreciation coupled with Trump check in and upcoming budget has created a volatility in the market, it's a great time to accumulate for the long term. Keep buying every dip.
BNF's PE ratio is below mean and is bound to rebound with slightest signal in economic upturn.
Keep buying BNF

04/02/2025 Banknifty Breakout Resistance line Today Banknifty Breakout Resistance 49700 line .last 4 times support this line. Today Banknifty close above this line but no volume support for breakout .
