Monday Nifty50 Analysis Monday Nifty Analysis
Nifty may open gap up today
Work can be done by looking at the swing on both sides
A call side entry can be made when 23800 goes above for the upside
Support below is around 23300
#NIFTY50
BANKNIFTY trade ideas

Monday Bank Nifty Analysis Monday Bank Nifty Analysis
Banknifty can also gap up open
Work can be done by looking at the swing on both sides
Support is around 50200
There is a small support level near 50500
If it goes above 51300 call side entry can be made

BACK in the zone! Ready to REVERSE!! As we can see BANKNIFTY has reached our important demand zone and trendline support which has been respected for quite some while in bigger time frame. Also everyone seems to be bearish but we must expect the unexpected. Even if BANKNIFTY opens weak, we may expect sharp RECOVERY anytime trapping all unless it breaks below the trendline which will eventually change the trend so plan your trades accordingly.

Nifty Bank Index Chart Analysis
#### Chart Overview
The chart shows the Nifty Bank Index on a 1-day (1D) time frame, with candlestick patterns representing price movements. It includes technical indicators such as MACD, RSI, and volume, as well as additional tools like ATR Trailing Stops, support and resistance zones, and chart patterns. This setup is for analyzing market trends and making informed trading decisions.
---
#### Key Chart Features and Pattern Observations
1. **Price Trend**:
- The chart shows a significant downtrend in recent sessions, with red candlesticks dominating.
- A rejection at a key resistance zone (marked in pink) led to a sharp decline.
2. **Support and Resistance Zones**:
- Multiple **resistance levels** are highlighted near **53,888.30** and **52,000**, showing rejection.
- A strong support zone is visible at **49,787.10** (blue line), where buyers might show interest.
3. **Gaps**:
- A price gap is visible, which might be a potential magnet for price or resistance area.
---
#### Indicator Analysis
1. **Volume**:
- Negative volume bars indicate strong selling pressure in the last few sessions.
- Declining green volume in the uptrend signals weakening bullish momentum.
2. **MACD (12,26,9)**:
- **MACD Line (62.91)** is below the **Signal Line (140.63)**, confirming bearish momentum.
- The histogram shows increasing red bars, signaling a strong bearish divergence.
3. **RSI (4)**:
- The RSI value is **53.46**, indicating a neutral zone but leaning bearish.
- It's declining from overbought levels, which often signals a potential downtrend continuation.
4. **ATR Trailing Stops**:
- The indicator shows the price below the trailing stop, signaling a bearish sentiment.
- ATR highlights increased volatility in the recent downward move.
---
#### Key Levels or Price Levels
1. **Resistance Levels**:
- **53,888.30**: Major resistance where price reversed sharply.
- **52,000**: Intermediate resistance zone for potential short-term bounces.
2. **Support Levels**:
- **50,000**: Psychological round number and immediate support.
- **49,787.10**: A critical support zone where the price may consolidate or bounce.
---
#### Overall Summary
The chart suggests the Nifty Bank Index is in a bearish phase, with strong selling pressure dominating recent sessions. Indicators like MACD, volume, and RSI confirm bearish sentiment. The price is trading below major resistance levels, and sellers are in control. However, critical support at **49,787.10** might provide some relief.
---
#### Trading Strategy
1. **For Bears**:
- Enter short positions on pullbacks near **52,000** or **53,000** with a stop-loss above **53,888.30**.
- Target **50,000** and **49,787.10** for profits.
2. **For Bulls**:
- Wait for confirmation of a reversal at **49,787.10** before going long.
- Target **52,000** in case of a reversal, with a stop-loss below **49,500**.
3. **Neutral Strategy**:
- Avoid trading in the current high-volatility phase unless a clear direction emerges.
- Use a breakout or breakdown beyond key levels like **53,888.30** (upside) or **49,787.10** (downside).
---
#### Conclusion
The Nifty Bank Index is under strong bearish control, with sellers pushing prices lower after rejecting resistance zones. Traders should adopt a cautious approach, favoring bearish setups unless the price shows a clear reversal signal at the support levels.

Possibility of H&S pattern on Banknifty Banknifty formed evening star type structure on weekly chart and it could further lead to H&S break in the future.

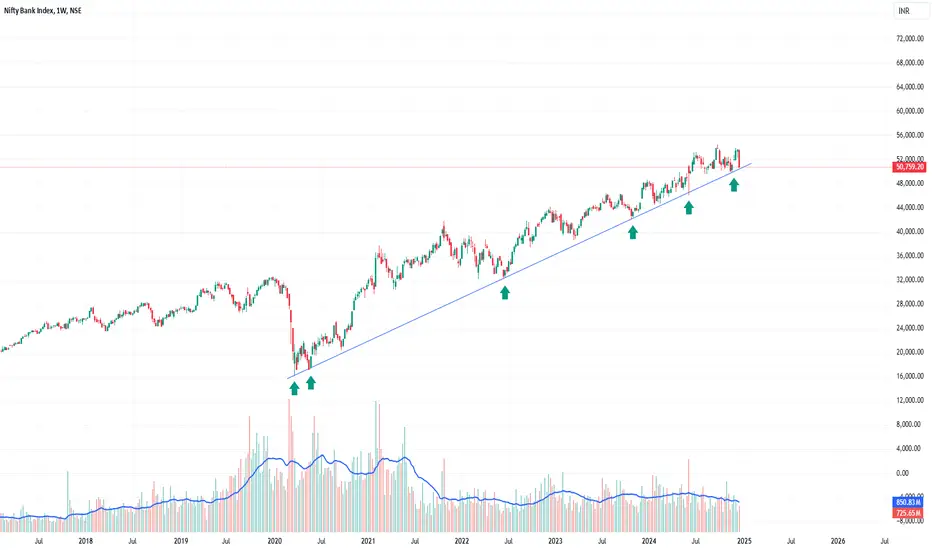
Example of Long term uptrend & Trend line support in Bank nifty
INDEX: Bank nifty
LEARNING:
1. Bank Nifty has continuously supported the same trend line since 2020.
2. Bank nifty supported the same trend line almost six times.
NOTE: For learning purposes
BankNifty Intraday Support & Resistance Levels for 23.12.2024On Friday, BankNifty opened with a gap-down, climbing to a high of 51,629 before plummeting nearly 1,000 points to a day low of 50,609.35, entering the Daily Demand Zone. It closed negative for the 4th straight session at 50,759.20, losing 816 points. The Weekly Trend (50 SMA) remains sideways, while the Daily Trend (50 SMA) has turned negative.
Demand/Support Zones
Near Demand/Support Zone (Daily): 49,787.10 - 50,983.50 (current price inside the zone)
Far Support Level: 49,282.64 (61.8% FIBO retracement)
Supply/Resistance Zones
Near Supply/Resistance Zone (125m): 52,010.65 - 52,368.30
Far Supply/Resistance Zone (125m): 52,709.40 - 52,911.10
Far Supply/Resistance Zone (Weekly): 53,741.40 - 54,467.35 (tested)
Outlook
After shedding almost 3,000 points in the past week, BankNifty has entered an oversold zone on the 75m timeframe and closed inside the Daily Demand Zone. A bounce-back is possible unless this critical zone is breached.

Database in Trading Trading data is a sub-category of financial market data. It provides real-time information about stock and market prices as well as historical trends for assets such as equities, fixed-income products, currencies and derivatives.
Results show that migration to a MongoDB database would be most beneficial in terms of cost, storage space, and throughput. In addition, organisations wishing to take advantage of autoscaling and the maintenance power of the cloud should opt for a cloud native solution

Option and Database trading To study an option chain, focus on the current market price, displayed in the centre. Analyse the built-up data to understand market direction based on recent changes in open interest and price. ITM call options are typically highlighted in yellow, making it easier to distinguish them from other options.
The put-call ratio measures trading volume using put options versus call options. Instead of the absolute value of the put-call ratio, the changes in its value indicate a change in overall market sentiment.

RSI Divergence Trading RSI divergence is fairly reliable, especially when used alongside other technical indicators for confirmation. However, like all technical tools, it's not foolproof and should be used as part of a broader strategy that includes risk management.
A bullish divergence occurs when the price of a security is moving downwards along with making lower lows while the RSI indicator is making higher lows. These movements indicate an increasing bullish momentum where traders can enter a long position when the security shows signs of upward reversal.
Examples of bullish RSI divergence: Example 1: Stock price falls to a new low, but RSI forms a higher low. Example 2: Forex pair decreases in value, but RSI shows increasing troughs. Example 3: Cryptocurrency drops, but RSI indicates an upward momentum shift

Option Chain in Trading What is Implied Volatility (IV)? Implied Volatility (IV) uses an option price to determine and calculate what the current market is talking about, the future volatility of the option's underlying stock. Implied volatility is one of the six essential factors used in options pricing models
The Nifty Option Chain provides a listing of all the available options contracts for the Nifty 50 Index; including the strike prices, expiry dates, and the corresponding premiums. The list shows all call and put options that are available against a specific underlying
The most successful options strategy is one that has the highest probability of profit, taking into consideration the trader's market outlook. In a bull market, selling puts can be a profitable strategy due to the statistical edge of most puts expiring worthless

Lecture For Option Trader If you think the stock price will move up: buy a call option, sell a put option. If you think the stock price will stay stable: sell a call option or sell a put option. If you think the stock price will go down: buy a put option, sell a call option
Derivatives - Options & Futures: Interactive Brokers.
Practical Guide to Trading: Interactive Brokers.
Trading Strategies in Emerging Markets: Indian School of Business.
Pricing Options with Mathematical Models: Caltech.

Bank nifty trades and targets - 23/12/24Hello Everyone. The market was in a bearish mode today. If the market opens flat then we can see continuation of trend. If it opens gap up then we need to see the resistance level to break before looking for CE trades. If it opens gap down then look for PE trades after support zone is broken. Let the market settle in first 15 to 30 minutes then look for directional trades. Book profits every 100 points as we are getting very few trending moves.

BULL VS BEAR (A.D.X)The average directional index (ADX) is a technical indicator used by traders to determine the strength of a financial security's price trend. It helps them reduce risk and increase profit potential by trading in the direction of a strong trend.
Is ADX good for day trading?
There are far too many fake breakouts that can leave traders trapped in a bad trade position. The ADX helps validate breakouts. That is, when the price breaks out with an ADX reading of above 25, it implies that momentum in the new direction can be sustained

BANKNIFTY Seems BearishBANKNIFTY Seems Bearish - It is not as weak as NIFTY and seems more support levels to bounce back.
Trigger point - Exhaustion Gap break
Booster - lower Low Formation
Support Level : 50195 / 49650 / 49030 / 48650
Resistance : 51510 / 51945
- This is no recommendation - only my personal analysis.

BANK NIFTY GANN SEASONAL ANALYSIS FALL SEASON SEPT-DEC 2024Fall season started with a brief rise and literal fall for the Bank Nifty Index. Squaring the High we got hit on price death zone level of 50185.55. Level has worked perfectly till date. we got a cycle move it 52454.85 three times and fourth time it went through it. High coming on a minor sectional level of 53892.35 on time death zone and fall started again. We are at a major sectional 50634.15 which needs to be watched hereafter. Major Cycle level coming in at 49867.35 hit on 21 Nov 2024. For growth we need to stay above the level of 50017.35 on the index. Use this update for the Dec expiry. We may another dull season till March 2025 and momentum can start from there if not early in the next winter season.
Happy Trading !!!

Through this video it has been told what will be the view of theThrough this video it has been told what will be the view of the market on Monday, where will the market go and an attempt has been made to calm the fear that has settled in the heart due to the fall of the market.

BankNIFTY: Channel Trading Opens Buying Opportunities Topic Statement: BankNIFTY has fallen alongside NIFTY as major bank stocks slipped, creating buying opportunities near key support levels.
Key Points:
1. The price is near the lower end of the up-trending channel, ideal for buying.
2. The price is touching the 180-day moving average, offering a strong entry point.
3. Gaps formed during the fall suggest the price will eventually return to higher levels.

Banknifty : Head n Shoulder Pattern (Preparing for a big Fall ?)Banknifty is showing resistance at 53700 n fall from there.
a possible Head n Shoulder Pattern is emerging.
Banknifty might hold the lead in fall in capital market.
do not take positions in banking sector unless it closes above 53700.
closing above it will move very higher within few weeks
Put Stoploss on closing basis.
(In Trading Time it may go above/below stoploss But closing price is most important).
These are levels are generated on the basis on Fibonacci Series
NOTE : I am not SEBI registered advisor in capital market.
Disclaimer:- Please always do your own analysis or consult with your financial advisor before taking any kind of trades. Please understand Risk in trading before taking any trade with your financial consult. I am only sharing my knowledge it may be right or sometimes wrong so I am not liable for any loss.
Dear traders, If you like my work then do not forget to hit like and follow me, and guy's let me know what do you think about this idea in comment box, i would be love to reply all of you guy's.
Thank you.

Bank Nifty intraday key levels for 23.12.24Hi,
* Bank Nifty intraday key levels for 23.12.24
* Please mark the levels in your chart and get prepared for tomorrow
* These Support and Resistance levels have good accuracy.
Resistance
R1 51270 / 51300
R2 51650 / 51700
Support 50500 / 50200
* As we are at a strong buying zone, we might witness a strong pull back in coming week
* Below 49600 on daily closing basis, market will witness more weakness
Regards
Bull Man

Banknifty Intraday Analysis for 20th December 2024NSE:BANKNIFTY
Index closed near 51575 level and Maximum Call and Put Writing near CMP as below in December Month contract:
Call Writing
52500 Strike – 21.05 Lakh
52000 Strike – 14.27 Lakh
51500 Strike – 11.46 Lakh
Put Writing
51000 Strike – 14.56 Lakh
51500 Strike – 12.07 Lakh
52000 Strike – 11.25 Lakh
Index has resistance near 52000 – 52200 range and if index crosses and sustains above this level then may reach near 52500 – 52600 range.
Index has immediate support near 51100 - 51000 range and if this support is broken then index may tank near 50400 - 50300 range.

BankNifty levels - Dec 23, 2024Utilizing the support and resistance levels of BankNifty, along with the 5-minute timeframe candlesticks and VWAP, can enhance the precision of trade entries and exits on or near these levels. It is crucial to recognize that these levels are not static, and they undergo alterations as market dynamics evolve.
The dashed lines on the chart indicate the reaction levels, serving as additional points of significance. Furthermore, take note of the response at the levels of the High, Low, and Close values from the day prior.
We trust that this information proves valuable to you.
* If you found the idea appealing, kindly tap the Boost icon located below the chart. We encourage you to share your thoughts and comments regarding it.
Wishing you successful trading endeavors!

Banknifty Trade set up with 1:5+ RRAs of December 19, 2024, Bank Nifty has experienced a significant downward movement:
The index fell by more than 1300 points over two trading days
It reached a low of 51263 levels
This sharp decline was accurately predicted using Neo wave and price action analysis, demonstrating the effectiveness of these techniques in forecasting market movements
Key Price Levels and Targets
Several important price levels have been identified:
A critical support level at 52580
Potential targets on the downside include 52180 and 518001.
Resistance level at 53200, which needs to be broken for fresh buying to emerge
