31/01/2025 Banknifty Retest Resistance lineToday Banknifty Retest Resistance line. The 49700 resistance level last 4 time support then fifth time on 09/01/2025 breakdown. Today Banknifty retest resistance and close down on this line .
BANKNIFTY trade ideas

BANKNIFTY MATHEMATICAL LEVELSThese Levels are based on purely mathematical calculations.
How to use these levels :-
* Mark these levels on your chart.
* Safe players Can use 15 min Time Frame
* Risky Traders Can use 5 min. Time Frame
* When Candle give Breakout / Breakdown to any level we have to enter with High/Low of that breaking candle.
* Targets will be another level marked on chart
* Stop Loss will be Low/High of that Breaking Candle.
* Trail your SL with every candle.
* Avoid Big Candles as SL will be high then.
* This is one of the Best Risk Reward Setup.
For Educational purpose only

Support and Resistance 'Support' and 'resistance' are terms for two respective levels on a price chart that appear to limit the market's range of movement. The support level is where the price regularly stops falling and bounces back up, while the resistance level is where the price normally stops rising and dips back down.
The basic strategy is to buy at the support level and sell at the resistance level, recognizing that these are zones of potential demand and supply changes. How does resistance work?

BANKNIFTY Levels for January 30, 2025BANKNIFTY Levels for Today
Here are the today's BANKNIFTY Levels for intraday. Based on market movement, these levels can act as support, resistance or both.
Please consider these levels only if there is movement in index and 15m candle sustains at the given levels.
The SL (Stop loss) for each BUY trade should be the previous RED candle below the given level. Similarly, the SL (Stop loss) for each SELL trade should be the previous GREEN candle above the given level.
Note: This idea and these levels are only for learning and educational purpose.
Your likes /boosts gives us motivation for continued leaning and sharing ideas.

Nifty & Bank Nifty - Are they ready to bounce?Nifty & Bank Nifty - Both indices gave a welcome and much awaited upward close today. But will this sustain is to be seen.
Watch this video to understand certain data points which may decide tomorrow's move.

Option TradingOptions are a type of contract that gives the buyer the right to buy or sell a security at a specified price at some point in the future. An option holder is essentially paying a premium for the right to buy or sell the security within a certain time frame.
When options are better. Options can be a better choice when you want to limit risk to a certain amount. Options can allow you to earn a stock-like return while investing less money, so they can be a way to limit your risk within certain bounds. Options can be a useful strategy when you're an advanced investor.

Data TradingMarket data is a broad category of information about the financial markets, consisting of essential details like price, bid/ask quotes, trading volume, trading period (high, low, open, or closed), etc.
Options trading is a type of financial trading that allows investors to buy or sell the right to purchase or sell an underlying asset at a fixed price, at a future date. Options trading operates on the basis that the buyer has the option to exercise the contract but is not under any obligation to do so.

Database and Option TradingOptions data captures information on options contracts, including pricing and trading volumes, useful for investment strategies. Discover our guide and top options data providers.
Simply put, when Open Interest increases, it means more money is moving into the futures contract, and when open interest drops, it means money is moving out of the contract. One can draw inference from this example.

Bank nifty trades and targets - 27/1/25Hello Everyone. The market was in a bearish mode today. If the market opens flat then we can see continuation of trend. If it opens gap up then we need to see the resistance level to break before looking for CE trades. If it opens gap down then look for PE trades after support zone is broken. Let the market settle in first 15 to 30 minutes then look for directional trades. Book profits every 100 points as we are getting very few trending moves.

BANKNIFTY MATHEMATICAL LEVELS These Levels are based on purely mathematical calculations.
How to use these levels :-
* Mark these levels on your chart.
* Safe players Can use 15 min Time Frame
* Risky Traders Can use 5 min. Time Frame
* When Candle give Breakout / Breakdown to any level we have to enter with High/Low of that breaking candle.
* Targets will be another level marked on chart
* Stop Loss will be Low/High of that Breaking Candle.
* Trail your SL with every candle.
* Avoid Big Candles as SL will be high then.
* This is one of the Best Risk Reward Setup.
For Educational purpose only

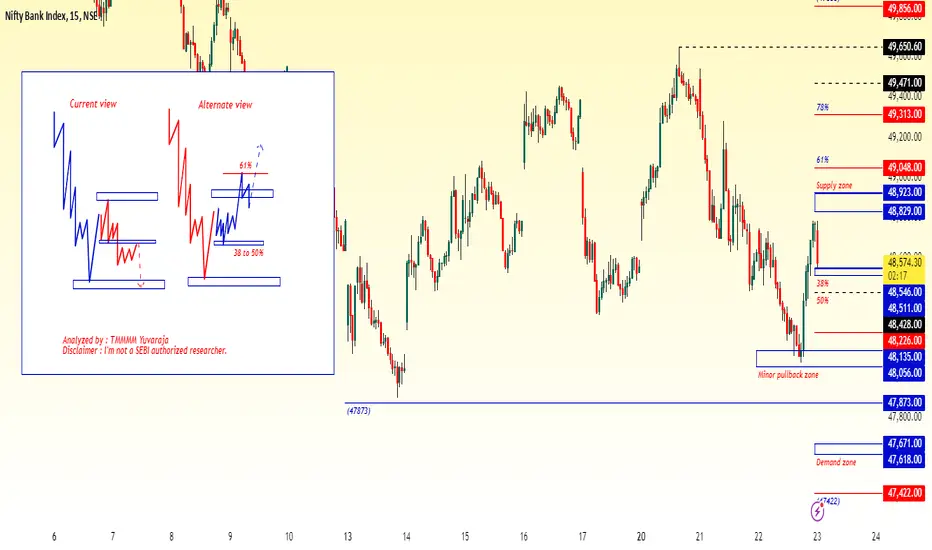
#Banknifty directions and levels for January 23rd:Bank Nifty Current View:
The Bank Nifty current view has two variations:
> First Variation: If the gap-down sustains, it will likely consolidate within the previous day's range. In this sentiment, a correction will only be expected if it breaks the previous bottom, meaning that until the previous bottom is broken, the market bias could remain moderately bullish.
> Second Variation: This is conditional; the initial market should take a solid pullback and could reject around the immediate resistance zone. If this occurs, the market will turn into a correction phase, supported by structural reasons.
Alternate View:
The alternate view is similar to that of Nifty. If the gap-down does not sustain or if the market finds support around the 38%, we can expect some consolidation between the 38% and the upside 61% mark. In this case, the supply zone may not be as effective.
BankNifty's Elliott Wave : Can It Reach Targets 49250+ & 49650+ As Elliotticians, this is one of the cardinal rules often overlooked, leading analysts and traders into traps. However, knowing the "line in the sand" where you could go wrong—48610—is crucial.
Getting the opportunity and executing the trade is another challenge, leaving no room for emotions. Emotions in trading can be dangerous; in fact, managing emotions is equally important in real-life decision-making.
As discussed earlier today, just 60 minutes ago, the question remains: Can we touch 49250+ and 49650+ upside targets?
Always consult your financial advisor before making any trades.
Regards,
WaveTalks
Market Whispers - Can You Hear Them?

BANKNIFTY Levels for January 27, 2025BANKNIFTY Levels for Today
Here are the today's BANKNIFTY Levels for intraday. Based on market movement, these levels can act as support, resistance or both.
Please consider these levels only if there is movement in index and 15m candle sustains at the given levels.
The SL (Stop loss) for each BUY trade should be the previous RED candle below the given level. Similarly, the SL (Stop loss) for each SELL trade should be the previous GREEN candle above the given level.
Note: This idea and these levels are only for learning and educational purpose.
Your likes /boosts gives us motivation for continued leaning and sharing ideas.

Banknifty next key date on 6th febBank Nifty Index study with price action : Previously last week we had predicted for banknifty to achieve target of 48352 on 17 - 01- 2025 and next 49069 by 22 - 01 - 2025. The second prediction had a little miss but price went further down when the key date came on 22-01-2025. This key date was previously predicted for Nifty. Nifty did a good marking on this day, but Banknifty was hesitant to achive same ( by going further down similar to Nifty).
We assume that, bank nifty will be going sideways/downward till 6 - feb - 2025, still it has playing range till 47900. Also on 22nd jan ( key date ), we assumed Banknifty should touch 47900, but it was shy of 150+ points. But technically, it already achieved the target values ( see above for 17th and 22nd jan ). So what can be next down target ?, is not analyzed here.
It is little difficult to predict the days in advance when both indexes are not in sync here ( Nifty 50 and Bank nifty). As predicted in another post for nifty key date of 5th feb 2025, here we try to see a next key date for bank nifty and it comes to 6th feb 2025. What is a key date ?, not explained here.
When we have confusion in day chart for the time+price, we can assume (with lesser accurary), by going through other timeframes, which we will do in other posts.
As per price action, the market is still in a sideways/downward retracement ( bearish ). And we assume it will correct/sideways till 6th feb 2025 before doing further upward movement (bullish) which can be short upward correction or a change in direction ( that study we can do later ).
So the summarize:
Banknifty next key date 6th Feb 2025 ( will it be at end of smaller swing ? )

BANKNIFTY stuck in a Range in 1 hour timeframeObservations
BANKNIFTY has been consolidating within a defined range for the past 4 trading sessions in one hour candle chart
Support level: 48000
Resistance level: 49660
Price action has been characterized by lack of strong directional bias
Trading Idea
Breakout Strategy:
Long Entry: A decisive break above the resistance level 49660 with increased volume and confirmation from indicators.
Stop-Loss: Below the recent swing low within the range.
Target: Risk-Reward ratio of 1:2
Short Entry: A decisive break below the support level 48000 with increased volume and confirmation from indicators.
Stop-Loss: Above the recent swing high within the range.
Target: Risk-Reward ratio of 1:2
Considerations:
Volume: Increased volume on the breakout can strengthen the move.
Indicators: Consider using indicators like RSI, MACD, or Bollinger Bands to identify potential divergences or confirmations.
News & Events: Be aware of upcoming budget events that could impact market sentiment.
Disclaimer: This is for informational purposes only and not financial advice. Trading involves risk, and you should always conduct your own research and consult with a qualified financial advisor before making any investment decisions.

Bank nifty 30 min chat Wave analysisBank nifty 30 min chart wave analysis
Market usually trade in motive and correction phase
Bank nifty price travel 47898 to 49459 in motive wave formation as 12345
after that market produce irregular flat correction which is denoted by abc
I anticipate next impulse wave target price above 50000
keep in mind validation level 47898
Disclaimer
I am not SEBI Registered Financial Adviser, it is my personal research and view only for educational purpose, before taking any trade please advise your financial adviser.
Thanks
MKT Learner

24/01/2025 Bank Nifty Support & ResistanceBank Nifty Meager Resistance point is 49700 and down side big nearest support is 46077 more chance is down side 2000 point chance

BankNifty Intraday Support & Resistance Levels for 27.01.2025On Friday, BankNifty opened flat to negative and experienced a volatile session. It initially hit a low of 48,347.85, then rallied to the day’s high of 48,858.65 before declining sharply to a new low of 48,203 by the end of the day. The index closed at 48,367.80, losing 221 points compared to the previous close. The Weekly Trend (50 SMA) remains sideways, while the Daily Trend (50 SMA) continues to be negative.
Demand/Support Zones
Near Minor Demand/Support Zone (5m): 48,074.05 - 48,171.10
Far Support Zone: 46,077.85 (low from 4th June 2024)
Far Demand/Support Zone (Daily): 44,633.85 - 45,750.40
Supply/Resistance Zones
Near Supply/Resistance Zone (Daily): 49,230.15 - 50,447.60 (tested multiple times)
Near Supply/Resistance Zone (75m): 49,787.70 - 49,979.05 (inside the Daily supply zone)
Far Supply/Resistance Zone (Weekly): 50,485.05 - 51,979.75
Far Supply/Resistance Zone (75m): 50,904.35 - 51,088.90 (inside the Weekly supply zone)
Outlook
This marks the third consecutive week that BankNifty has closed below the crucial June 2024 election week closing levels, indicating persistent selling pressure. Unless BankNifty finds support in the 47,800–48,000 zone, further downside could unfold in the coming days.
However, a breakout above 49,000 and sustained trading in that range could trigger a bullish move, targeting the 50,000–50,500 zone.
With the Union Budget 2025 approaching, heightened volatility is expected. Trade cautiously and keep an eye on key levels!

Bank Nifty View for 27 Jan 2025Bank Nifty is in down trend.
Support @ 48075 and 47900.
I will try to buy near 47900 with little stop loss. ( If price close below 47900 on 15M chart then I will exit from buy).
I will Sell below 47900. If 47900 breaks then 1st target is 46900.
!! Radha Radha !!

BankNifty levels - Jan 27, 2025Utilizing the support and resistance levels of BankNifty, along with the 5-minute timeframe candlesticks and VWAP, can enhance the precision of trade entries and exits on or near these levels. It is crucial to recognize that these levels are not static, and they undergo alterations as market dynamics evolve.
The dashed lines on the chart indicate the reaction levels, serving as additional points of significance. Furthermore, take note of the response at the levels of the High, Low, and Close values from the day prior.
We trust that this information proves valuable to you.
* If you found the idea appealing, kindly tap the Boost icon located below the chart. We encourage you to share your thoughts and comments regarding it.
Wishing you successful trading endeavors!

Bank Nifty Levels for Today 22nd-Jan-2025: Key Zones to WatchGood morning guy's i hope you all will be doing good. Let's start analysis of Banknifty:
Bank Nifty is currently trading around 48,626, offering a well-defined trading setup for both buyers and sellers. A breakout above 48,752 could indicate bullish momentum, with potential targets at 48,973, 49,195, and 49,608, while keeping a stop loss at 48,453. On the other hand, if the price breaks below 48,453, it may lead to a bearish move, targeting 48,252 and 47,972, with a stop loss at 48,752. The important support zone between 47,972 and 48,090 remains a key area to watch for price reversals or further breakdowns.
Looking at the indicators, the RSI suggests bearish divergence but hints at a possible recovery from oversold conditions, while the MACD continues to reflect bearish momentum. Traders should focus on price action around these levels to identify potential opportunities.
Disclaimer: This analysis is purely for educational purposes and does not constitute financial advice. Always do your own research or consult a professional advisor before trading.
If you found this analysis helpful, make sure to follow for regular market insights and share your thoughts in the comments below. Let’s grow together as traders!

BankNifty is in value buy zone Banknifty is deep value buy zone. In near future this can go beyond 55000 and we are trading near 48000. INR depreciation coupled with Trump check in and upcoming budget has created a volatility in the market, it's a great time to accumulate for the long term. Keep buying every dip.
BNF's PE ratio is below mean and is bound to rebound with slightest signal in economic upturn.
Keep buying BNF

Bank Nifty: Dynamic Trendline Resistance and Support BreakdownChart Description:
Dynamic Resistance: Highlight the descending trendline acting as a strong resistance. Mark recent rejection points from this line.
Dynamic Support: Add the upward-sloping support line showing recent price bounces.
Key Levels:
47600: Potential target if support breaks, indicating a bearish continuation.
47600: Swing low zone, which could act as a short-term target in the bear trend.
Bearish Breakdown: Indicate potential price action if the dynamic support is breached, targeting levels below 47500.
Risk Management: Add possible stop-loss placement near the trendline resistance for short positions.
Idea Summary:
Watch for price rejection at the dynamic trendline resistance.
A breakdown of the dynamic support line will signal a bearish move.
Target levels: 47600 (swing low) and below 47500 in case of extended bearish momentum.
Disclaimer :
This analysis is for educational and informational purposes only. It is not financial advice or a recommendation to trade. Trading in financial markets involves significant risk, and you should only trade with capital you can afford to lose. Perform your due diligence or consult a financial advisor before making any trading decisions.
