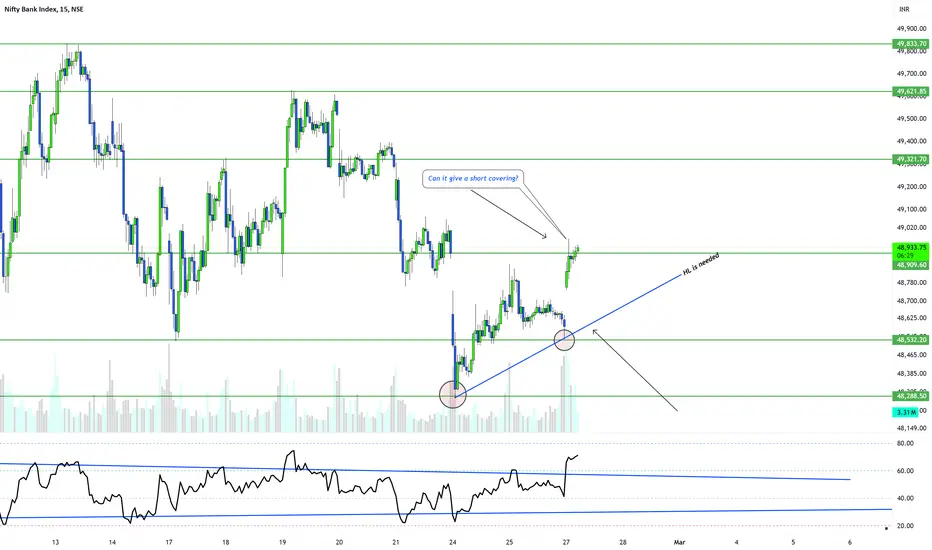
Bank Nifty View - 27 Feb 2025 - BNF Expiry short covering rally?Today, BNF has been accumulating since morning. We can expect a big move around 3 PM. Since today is the monthly expiry, there can be a short-covering rally.
I will however not be trading in large qty but just 1 lot to observe.
BANKNIFTY trade ideas

BANKNIFTY! Can it give a big move? Weekly zones!As per the trend BANKNIFTY is trying to sustain above 49000, which is a strong RESISTANCE.
If you want to follow up the trend UPSIDE then one should wait for HLs for a confirmation. Also, the trend changes if any of the big strikes gets eliminated. In this current scenario we are probably waiting for a confirmation.
I have marked the important Support & Resistances to help you in a better way.
INDIA VIX is down right now which is giving a good support to option buyers and Sellers.
As per the study let it close above today's high and give a HL confirmation for a trend change on a 15 mins time frame.
IMPORTANT ZONES TO WATCH : 49000-49100
NOTE: I'm not a SEBI reg. Study before investing.
Bank Nifty 27 Feb 2025Kindly take note of the analysis for bank nifty on 27 Feb 2025. The blue bold line represents the resistance level,while the red bold line Ins the support level. The yellow dotted lines mark the targets on both sides, and the trend line(s) should be carefully considered. It's crucial to develop a trading strategy based on this information. Please note that this is my personal view, and there may be possibility of error.

BANKNIFTY Levels for 26-02-2025Resistance Levels (Red Lines)
Strong Resistance: 49,731.80
Resistance-2: 49,233.75
Resistance-1: 49,005.95
BreakOut Level: 48,784.05
The price is currently below all resistance levels, meaning upside movement might face selling pressure at these levels.
Support Levels (Green Lines)
BreakDown Level: 48,377.65
Support-1: 48,051.35
Support-2: 47,710.00
Strong Support: 47,497.15
The BreakDown Level (48,377.65) is crucial. If the price breaks below this level, it may head toward Support-1 (48,051.35) and further down to 47,710.00.
Pattern Analysis:
The Roof Pattern shows a sloping downtrend after reaching a peak.
The BreakOut Level (48,784.05) is the key level. A breakout above this level could lead to a retest of 49,005.95. If the price breaks above 48,784.05, it could test 49,005.95 and possibly 49,233.75.
The Base Line of the pattern suggests possible downside continuation if support levels break.
If the price breaks below 48,377.65, expect further downside toward 48,051.35 and 47,710.00.

Banknifty Intraday Analysis for 25th February 2025NSE:BANKNIFTY
Index closed near 48650 level and Maximum Call and Put Writing near CMP as below in February Month contract:
Call Writing
50000 Strike – 23.24 Lakh
49000 Strike – 16.95 Lakh 49500 Strike – 16.33 Lakh
Put Writing
44500 Strike – 15.32 Lakh
47000 Strike – 14.42 Lakh
48000 Strike – 13.04 Lakh
Index has resistance near 49050 – 49150 range and if index crosses and sustains above this level then may reach near 49650 – 49750 range.
Index has immediate support near 48250 - 48150 range and if this support is broken then index may tank near 47850 - 47750 range.

What is support and resistance ?**SkyTradingZone** is your go-to source for educational content on trading, covering market insights, strategies, and in-depth analysis. Our goal is to empower traders with knowledge to navigate the markets effectively.
---
# **What is Support and Resistance?**
Support and resistance are **key technical analysis concepts** that help traders identify important price levels where the market tends to react. These levels act as **barriers** that influence price movements, making them essential for trading strategies.
---
## **1️⃣ What is Support?**
📌 **Definition:**
Support is a price level where buying pressure is strong enough to **prevent the price from falling further**. It acts as a floor where demand overcomes supply, causing the price to **bounce upward**.
📌 **Why is Support Important?**
- Indicates **potential buying zones**.
- Helps traders set **stop-loss levels** below support.
- Provides entry points for **buy trades** when the price bounces.
📌 **Example of Support:**
If **Nifty 50 repeatedly bounces from 18,000**, it means this level is acting as a strong **support zone**.
📌 **How to Identify Support Levels?**
✅ **Previous Swing Lows** – Look at past price action to find levels where price reversed.
✅ **Fibonacci Retracement Levels** – Key levels like **61.8% or 38.2%** often act as support.
✅ **Trendline Support** – In an uptrend, a diagonal trendline can act as support.
✅ **Moving Averages (50 EMA, 200 EMA)** – These act as dynamic support zones.
---
## **2️⃣ What is Resistance?**
📌 **Definition:**
Resistance is a price level where selling pressure is strong enough to **prevent the price from rising further**. It acts as a ceiling where supply overcomes demand, causing the price to **reverse downward**.
📌 **Why is Resistance Important?**
- Indicates **potential selling zones**.
- Helps traders set **stop-loss levels** above resistance.
- Provides exit points for **sell trades** when the price gets rejected.
📌 **Example of Resistance:**
If **Bank Nifty struggles to break above 45,000**, that means this level is acting as a strong **resistance zone**.
📌 **How to Identify Resistance Levels?**
✅ **Previous Swing Highs** – Levels where price was rejected before.
✅ **Fibonacci Levels** – **61.8% or 38.2% retracements** act as resistance.
✅ **Trendline Resistance** – A downward trendline can act as resistance.
✅ **Moving Averages (50 EMA, 200 EMA)** – These act as dynamic resistance.
---
## **3️⃣ Types of Support & Resistance**
### **🔹 1. Horizontal Support & Resistance**
- Fixed price levels that hold over time.
- Example: If **Reliance stock finds support at ₹2,400 multiple times**, that’s horizontal support.
### **🔹 2. Trendline Support & Resistance**
- Found in trending markets by drawing diagonal lines.
- Example: An **uptrend line** connecting higher lows acts as support.
### **🔹 3. Moving Average Support & Resistance**
- Dynamic support/resistance levels.
- Example: If **Nifty bounces from the 200 EMA**, it acts as support.
### **🔹 4. Fibonacci Support & Resistance**
- Price often respects Fibonacci retracement levels (e.g., **61.8%**).
- Example: If **Bank Nifty reverses from the 38.2% retracement**, it acts as resistance.
---
## **4️⃣ How to Use Support & Resistance in Trading?**
### **🔹 1. Trading the Bounce (Reversal Strategy)**
✅ **Buy near Support** – If price shows a bullish reversal at support, enter a buy trade.
✅ **Sell near Resistance** – If price gets rejected at resistance, enter a sell trade.
📌 **Example:**
- If **Nifty forms a bullish engulfing candle at support**, it’s a buy signal.
- If **Bank Nifty forms a shooting star at resistance**, it’s a sell signal.
---
### **🔹 2. Breakout Trading Strategy**
✅ **Breakout Above Resistance** – Signals bullish momentum.
✅ **Breakdown Below Support** – Signals bearish momentum.
📌 **Example:**
- If **Reliance breaks ₹2,500 with high volume**, enter a buy trade.
- If **Nifty breaks below 18,000**, enter a short trade.
📌 **Tip:** Always wait for **retest confirmation** before entering.
---
### **🔹 3. Support & Resistance with Indicators**
📌 **RSI + Support** → If RSI is **oversold** at support, strong buy signal.
📌 **MACD + Resistance** → If MACD shows bearish divergence at resistance, sell signal.
---
## **5️⃣ Live Example: Support & Resistance in Nifty 50**
| **Date** | **Price Level** | **Support/Resistance?** | **Trade Setup** |
|---------|--------------|------------------|---------------|
| Feb 10 | 17,800 | Strong Support | Buy Signal |
| Feb 12 | 18,200 | Resistance | Sell Signal |
| Feb 15 | 18,000 | Support Retest | Buy Signal |
📌 **Observation:**
- **Buying near support** (17,800) gave a profitable long trade.
- **Selling near resistance** (18,200) gave a good short trade.
---
## **6️⃣ Mistakes to Avoid in Support & Resistance Trading**
⚠️ **Ignoring Volume** – Confirm breakouts with high volume.
⚠️ **Trading False Breakouts** – Always wait for **retest confirmation**.
⚠️ **Forgetting Stop Loss** – Always set SL below support or above resistance.
---
## **7️⃣ Conclusion**
✅ Support & Resistance levels help traders find high-probability trading setups.
✅ They can be combined with **trendlines, moving averages, and indicators** for better accuracy.
✅ Always follow **risk management** and wait for confirmation before entering trades.
📌 In future lessons, we will cover:
- **How to Draw Perfect Support & Resistance Levels**
- **Advanced Trading Strategies Using S&R**
- **Live Chart Analysis of Support & Resistance**
Stay tuned for more insights!
---
🔹 **Disclaimer**: This content is for educational purposes only. *SkyTradingZone* is not SEBI registered, and we do not provide financial or investment advice. Please conduct your own research before making any trading decisions.

BANK NIFTY - INDEX 15 MIN CHART SETUPAll Technical Term Mention Here
RR 1:8 Sell Side Swing Trade Setup

Bank Nifty 25-Feb-2025 levelsMorning Bank Nifty is expected to open in flat and will touch 48445 in first 30 min and will revert back and expect close in green.
R1 48800
R2 49083
S1 48547
S2 48445
S3 48281

Banknifty if comes near 47900 then Buy only How to take trades using Harmonic pattern projection Trade setup is explained below :-
Entry : 1st D point : 0% is recent top or bottom.
Trailing SL: 20.2% is work as trailing SL of buy or sell trade if hit then we have to book profit
.If price goes below 20.2% then early or risky traders can reversal trade ,
Targets :
Target T1 : 28.3%
Target T1 : 37.8 %
Target T3 : 48.1%
T3: 60.2% to 66.9 % is our 3rd Target since this is reversal zone so must book profit if break then take fresh trade again
Next Targets are 77.5 % , 88.1 % 100% , 113.5 % , 127.3% , 141.2% and 160.2 , 177.5. final Target 200%
160.2 to 177.5% if profit booking area so book full profit and wait for reversal.
How to take reversal trade :
If price going upside/ downside then then buy or sell levels appear on Chart ( Automatically show when price reach any reversal zone of harmonic projection pattern based .
After showing reversal levels wait for confirmation until 20.2 % or 28.3 % level not break if break then exit from current buy / sell trade and take fresh reverse trade buy/ sell .
Trailing SL:
After reach 1st Target trail SL to just above or below cost ( for example we are holding sell trade from 100 1st Target 110 hit then move trailing sl to 104-105 and move SL as price move upside or Downside)
Re- Entry :
For Re-entry in any pull back Point D ( 10.1% ) is used for re-entry then SL recent high or low Point D ( 0% ) .
Target is same as early 20.2% , 28.3 , 37.8 and so on
Blue Line is 1st support/ Resistance
Green line is 2nd support/ resistance
Red line is 3rd Support/ resistance

Nifty & Bank Nifty - FII selling Vs Extremely oversold indicesRelentless selling from FIIs have pushed both Nifty and Bank Nifty further in oversold territory. But we have seen in past that markets have a tendency to remain in oversold/overbought territories for very long time as well.
But there are quite a few positives for the indices for the next session. Will these be able to fight and win over FIIs selling? Let's watch the video to figure this out.

Bank Nifty 25 Feb 2025Kindly take note of the analysis for bank nifty on 25 Feb 2025. The blue bold line represents the resistance level,while the red bold line Ins the support level. The yellow dotted lines mark the targets on both sides, and the trend line(s) should be carefully considered. It's crucial to develop a trading strategy based on this information. Please note that this is my personal view, and there may be possibility of error.

TOP BANKS AT DISCOUNT - Cheap valuation ( HDFC, ICICI, SBI, KOT)Think this is a critical time to give a thought on Banking stocks ( Top BANKS)
It's high time to accumulate any of the top banks (HDFC,SBI, ICICI, KOTAK). I will give fundamental & technical reasons backing this:
Valuation of these banks are insanely low , comparable to covid times ( if you adjust for the earnings & risk factor)
RBI has injected $10BN into banking to improve liquidity
RBI MPC committee ensured that further rate cuts likely in upcoming months ( irrespective of FED meeting outcome) to focus on growth than inflation at the moment
Government seems to have understood that they need to push up the economic activity given the macro & micro - very evident from the commentary
10 yr Indian government bond is downtrending
Rupee is down trending
FII has gone long in NIFTY futures suddenly on FRiday
Technically, the Banknifty is trading at lower end of the trading channel Banknifty is trading much lower than median PE ( usually perceived as oversold zone )

Banknifty next week 50500 to 48100 range trade both sideHow to take trades using Harmonic pattern projection Trade setup is explained below :-
Entry : 1st D point : 0% is recent top or bottom.
Trailing SL: 20.2% is work as trailing SL of buy or sell trade if hit then we have to book profit
.If price goes below 20.2% then early or risky traders can reversal trade ,
Targets :
Target T1 : 28.3%
Target T1 : 37.8 %
Target T3 : 48.1%
T3: 60.2% to 66.9 % is our 3rd Target since this is reversal zone so must book profit if break then take fresh trade again
Next Targets are 77.5 % , 88.1 % 100% , 113.5 % , 127.3% , 141.2% and 160.2 , 177.5. final Target 200%
160.2 to 177.5% if profit booking area so book full profit and wait for reversal.
How to take reversal trade :
If price going upside/ downside then then buy or sell levels appear on Chart ( Automatically show when price reach any reversal zone of harmonic projection pattern based .
After showing reversal levels wait for confirmation until 20.2 % or 28.3 % level not break if break then exit from current buy / sell trade and take fresh reverse trade buy/ sell .
Trailing SL:
After reach 1st Target trail SL to just above or below cost ( for example we are holding sell trade from 100 1st Target 110 hit then move trailing sl to 104-105 and move SL as price move upside or Downside)
Re- Entry :
For Re-entry in any pull back Point D ( 10.1% ) is used for re-entry then SL recent high or low Point D ( 0% ) .
Target is same as early 20.2% , 28.3 , 37.8 and so on
Blue Line is 1st support/ Resistance
Green line is 2nd support/ resistance
Red line is 3rd Support/ resistance

Bank Nifty Weekly Analysis: Key Levels & Trend OutlookWeekly Recap:
The Bank Nifty closed the week at 48981, posting a decline of -0.24%.
Key Weekly Levels for Next Week
Price Action Pivot Zone:
The crucial range to watch for potential reversals or trend continuation is 48,948 - 49,092
Support & Resistance Levels:
Support Levels:
S1: 48, 738
S2: 48,540
S3: 48,100
Resistance Levels:
R1: 49,248
R2: 49,426
R3: 48,881
Market Outlook:
Bullish Scenario: If Bank Nifty sustains above 49,092, it could see buying interest, potentially pushing towards R1 at 49,248 and higher levels.
Bearish Scenario: A breakdown below 48,948 could trigger further downside pressure, targeting S1 at 48,738 and lower support levels.

BankNIFTY: Holding Strength Amid Market CorrectionTopic Statement:
BankNIFTY is undergoing a correction but remains more resilient than NIFTY, with key retracement levels acting as support.
Key points:
1. The price has breached the weekly up-trendline, signaling an end to the bullish trend.
2. BankNIFTY may see further correction, shifting its trend to sideways or bearish.
3. Retracement levels will serve as key support zones during the correction.

Nifty Bank Index (1D timeframe) AnalysisMaster BreakOut Level - 51,976.90 (Strong Resistance)
The price needs to break and sustain above this level for a strong bullish move.
A breakout above this level can push the index towards new highs.
Resistance Level - 50,141.05
Acts as an intermediate resistance; price rejection from here can lead to a pullback.
If the price crosses this level with strong volume, an upward rally is expected.
Current Price - 48,981.20
The index is trading near a crucial zone, and movement below support levels could lead to further downside.
Support Level - 48,586.05
If the price holds above this level, a rebound can be expected.
If broken, it may test lower supports.
Open GAP Support Level - 48,382.80
A crucial area where buying interest might emerge.
If the price sustains above this, it can act as a demand zone.
Master Breakdown Level - 47,912.55 (Strong Support)
If this level breaks, a sharp downside move can occur.
A breakdown here indicates a bearish trend.

Bank nifty trades and targets for - 23/2/25Hello Everyone. Look for upside moves at resistance and downside moves at support. We have to look at previous market trend and decide which side trades to take at the start of the day. Do not go for trend opposite trades, you will end up seeing losses.
The market was in a bearish mode today. If the market opens flat then we can see continuation of trend. If it opens gap up then we need to see the resistance level to break before looking for CE trades. If it opens gap down then look for PE trades after support zone is broken. Let the market settle in first 15 to 30 minutes then look for directional trades. Book profits every 100 points as we are getting very few trending moves.

Bank Nifty 24 Feb 2025Kindly take note of the analysis for bank nifty on 24 Feb 2025. The blue bold line represents the resistance level,while the red bold line Ins the support level. The black dotted lines mark the targets on both sides, and the trend line(s) should be carefully considered. It's crucial to develop a trading strategy based on this information. Please note that this is my personal view, and there may be possibility of error.

Yesterday i said banknifty will fall 500 points same happened How to take trades using Harmonic pattern projection Trade setup is explained below :-
Entry : 1st D point : 0% is recent top or bottom.
Trailing SL: 20.2% is work as trailing SL of buy or sell trade if hit then we have to book profit
.If price goes below 20.2% then early or risky traders can reversal trade ,
Targets :
Target T1 : 28.3%
Target T1 : 37.8 %
Target T3 : 48.1%
T3: 60.2% to 66.9 % is our 3rd Target since this is reversal zone so must book profit if break then take fresh trade again
Next Targets are 77.5 % , 88.1 % 100% , 113.5 % , 127.3% , 141.2% and 160.2 , 177.5. final Target 200%
160.2 to 177.5% if profit booking area so book full profit and wait for reversal.
How to take reversal trade :
If price going upside/ downside then then buy or sell levels appear on Chart ( Automatically show when price reach any reversal zone of harmonic projection pattern based .
After showing reversal levels wait for confirmation until 20.2 % or 28.3 % level not break if break then exit from current buy / sell trade and take fresh reverse trade buy/ sell .
Trailing SL:
After reach 1st Target trail SL to just above or below cost ( for example we are holding sell trade from 100 1st Target 110 hit then move trailing sl to 104-105 and move SL as price move upside or Downside)
Re- Entry :
For Re-entry in any pull back Point D ( 10.1% ) is used for re-entry then SL recent high or low Point D ( 0% ) .
Target is same as early 20.2% , 28.3 , 37.8 and so on
Blue Line is 1st support/ Resistance
Green line is 2nd support/ resistance
Red line is 3rd Support/ resistance

Banknifty Intraday Analysis for 21st February 2025NSE:BANKNIFTY
Index closed near 49335 level and Maximum Call and Put Writing near CMP as below in February Month contract:
Call Writing
50000 Strike – 15.27 Lakh
49500 Strike – 13.31 Lakh 50500 Strike – 11.68 Lakh
Put Writing
49000 Strike – 15.45 Lakh
48500 Strike – 14.56 Lakh
48000 Strike – 14.16 Lakh
Index has resistance near 49900 – 50000 range and if index crosses and sustains above this level then may reach near 50400 – 50500 range.
Index has immediate support near 48800 - 48700 range and if this support is broken then index may tank near 48400 - 48300 range.

BANKNIFTY Levels February 21, 2025
BANKNIFTY Levels for Today
Here are the today's BANKNIFTY Levels for intraday. Based on market movement, these levels can act as support, resistance or both.
Please consider these levels only if there is movement in index and 15m candle sustains at the given levels.
The SL (Stop loss) for each BUY trade should be the previous RED candle below the given level. Similarly, the SL (Stop loss) for each SELL trade should be the previous GREEN candle above the given level.
Note: This idea and these levels are only for learning and educational purpose.
Your likes /boosts gives us motivation for continued leaning and sharing ideas.

Tomorrow 21st feb banknifty will fall 500-800 points sell rise How to take trades using Harmonic pattern projection Trade setup is explained below :-
Entry : 1st D point : 0% is recent top or bottom.
Trailing SL: 20.2% is work as trailing SL of buy or sell trade if hit then we have to book profit
.If price goes below 20.2% then early or risky traders can reversal trade ,
Targets :
Target T1 : 28.3%
Target T1 : 37.8 %
Target T3 : 48.1%
T3: 60.2% to 66.9 % is our 3rd Target since this is reversal zone so must book profit if break then take fresh trade again
Next Targets are 77.5 % , 88.1 % 100% , 113.5 % , 127.3% , 141.2% and 160.2 , 177.5. final Target 200%
160.2 to 177.5% if profit booking area so book full profit and wait for reversal.
How to take reversal trade :
If price going upside/ downside then then buy or sell levels appear on Chart ( Automatically show when price reach any reversal zone of harmonic projection pattern based .
After showing reversal levels wait for confirmation until 20.2 % or 28.3 % level not break if break then exit from current buy / sell trade and take fresh reverse trade buy/ sell .
Trailing SL:
After reach 1st Target trail SL to just above or below cost ( for example we are holding sell trade from 100 1st Target 110 hit then move trailing sl to 104-105 and move SL as price move upside or Downside)
Re- Entry :
For Re-entry in any pull back Point D ( 10.1% ) is used for re-entry then SL recent high or low Point D ( 0% ) .
Target is same as early 20.2% , 28.3 , 37.8 and so on
Blue Line is 1st support/ Resistance
Green line is 2nd support/ resistance
Red line is 3rd Support/ resistance

Bank nifty trades and targets for - 21/2/25Hello Everyone. The market was in a very tight range the previous day. Let the resistance or support range break with 15-minute candle before going for any trades. If we do trades in between these zones premium eating will happen and we end up seeing losses. Book profits every 100 points as we are getting very few trending moves. If the market opens flat then we can see continuation of trend. If it opens gap up then we need to see the resistance level to break before looking for CE trades. If it opens gap down then look for PE trades after support zone is broken. Let the market settle in first 15 to 30 minutes then look for directional trades.
