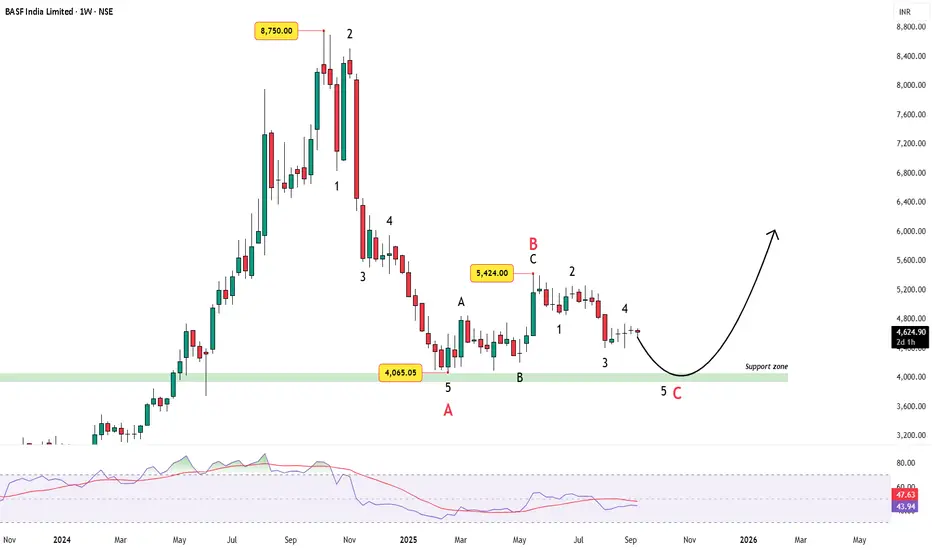
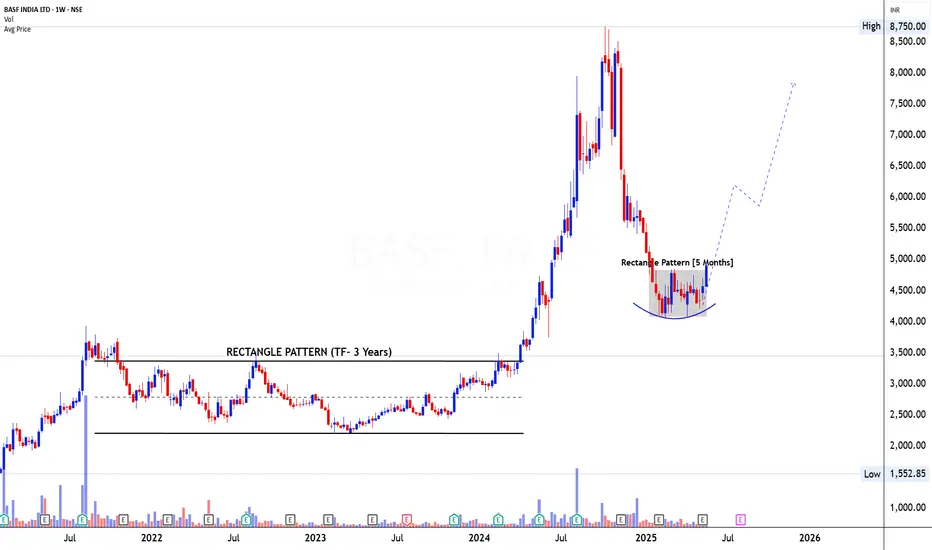
BASF India – 53% Correction Nearing Wave 5 SupportBASF India, a leading chemicals producer, has witnessed a sharp correction from its euphoric highs of ₹8,750. In just a few months, the stock retraced nearly 53%, wiping out more than half its gains.
Wave count
From the ATH, price unfolded into a 5-wave impulse decline, bottoming near ₹4,065.
BASF India Limited
No trades
Next report date
—
Report period
—
EPS estimate
—
Revenue estimate
—
86.65 INR
4.79 B INR
152.60 B INR
10.43 M
About BASF India Limited
Sector
Industry
CEO
Alexander Gerding
Website
Headquarters
Mumbai
Founded
1943
IPO date
Nov 3, 1994
Identifiers
2
ISIN INE373A01013
BASF India Ltd. engages in the manufacturing and sale of chemicals and chemical products. It operates through the following segments: Agricultural Solutions; Materials; Industrial Solutions; Surface Technologies; Nutrition and Care; Chemicals, and Others. The Agricultural Solutions segment focuses on crop protection division. The Materials segment consists of performance materials divisions, the monomers divisions and polyamides business. The Industrial Solutions segment includes dispersions and pigments divisions and performance chemicals divisions. The Surface Technologies segment is comprised of the construction chemicals, catalysts and coatings divisions. The Nutrition and Care segment is consisted of the care chemicals and nutrition and health divisions. The Chemicals segment offers petrochemicals, monomers, and intermediates. The company was founded on May 13, 1943 and is headquartered in Mumbai, India.
Related stocks
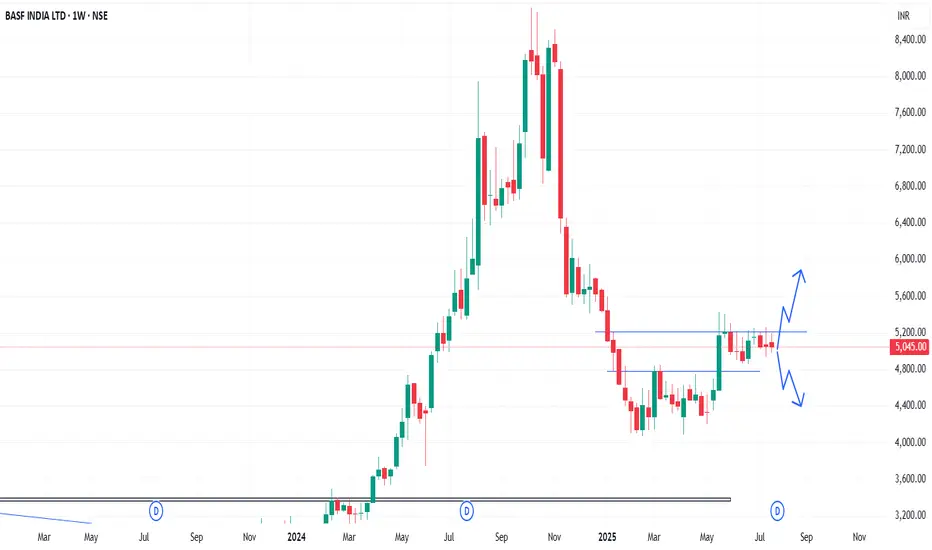
BASF - Weekly AnalysisIn the Weekly Chart of BASF ,
we can see that, it has consolidated near trendline.
Also, it is at decision making point.
Possible momentums are shown in chart.
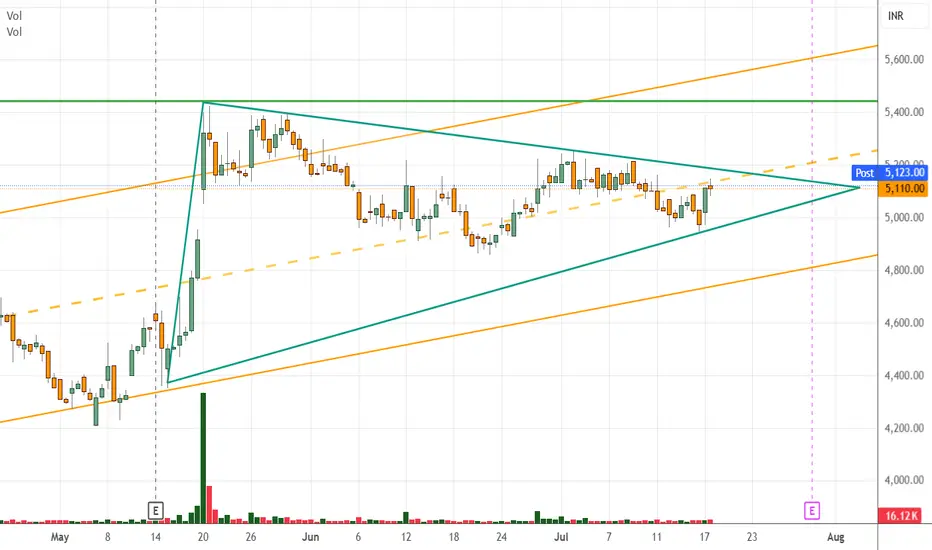
BASF India Ltd ₹ 5,115 3.11% 17 Jul 3:30 p.m.
If price breaks above Rs 5220 . in daily timeframe, then 1st Target is RS 5430 Stoploss your own.
DISCLAIMER:
I am not a SEBI-registered advisor. The content shared, including charts, ideas, and analysis, is purely for educational and informational purposes only. This should not be considered as
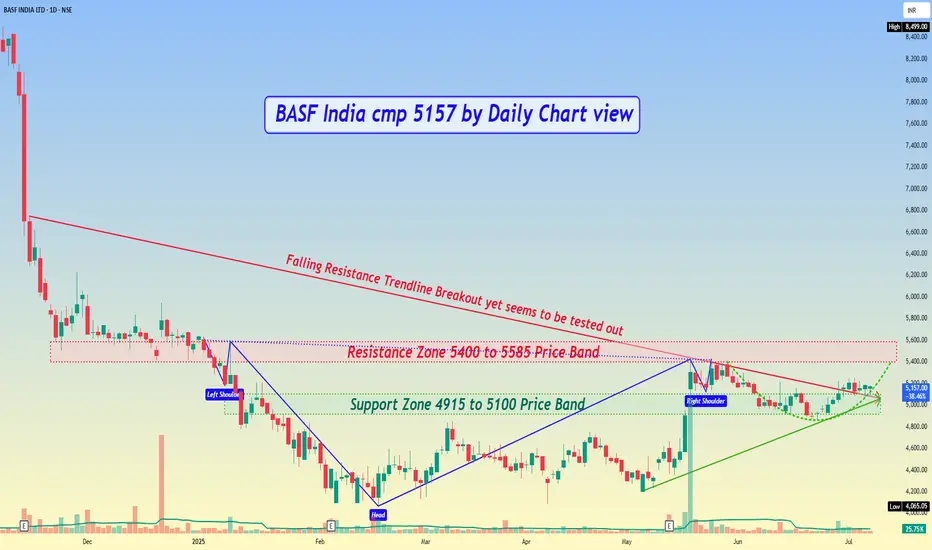
BASF India cmp 5157 by Daily Chart viewBASF India cmp 5157 by Daily Chart view
- Support Zone 4915 to 5100 Price Band
- Resistance Zone 5400 to 5585 Price Band
- Stock Price is in the process of Support Zone testing retesting
- Falling Resistance Trendline Breakout yet seems to be tested out
- Rising Support Trendline seems well respec
BASF- Rectangle Pattern Breakout🚀 Breakout Stock Alert: BASF India Ltd (BASF)
📌 Price: ₹4,902.90 📊 Volume: 138.03K 📅 Date: 19-05-2025
① Pattern Name, Timeframe, Structure & Explanation
Daily Timeframe: Rectangle Base Pattern (5 Months)
Weekly Timeframe: Base Formation in Uptrend
On the daily chart, BASF has been coiling ins
Swing Trade BASF
📍 LTP: ₹3902
Entry, Stop Loss (SL), and Targets are clearly mentioned in the chart.
There are 2 separate trade options provided —
Please follow them exactly as shared and do not mix them up.
🔹 If you choose Trade Option 1 (Buy on Dips) → Follow its specific SL
🔹 If you choose Trade Option

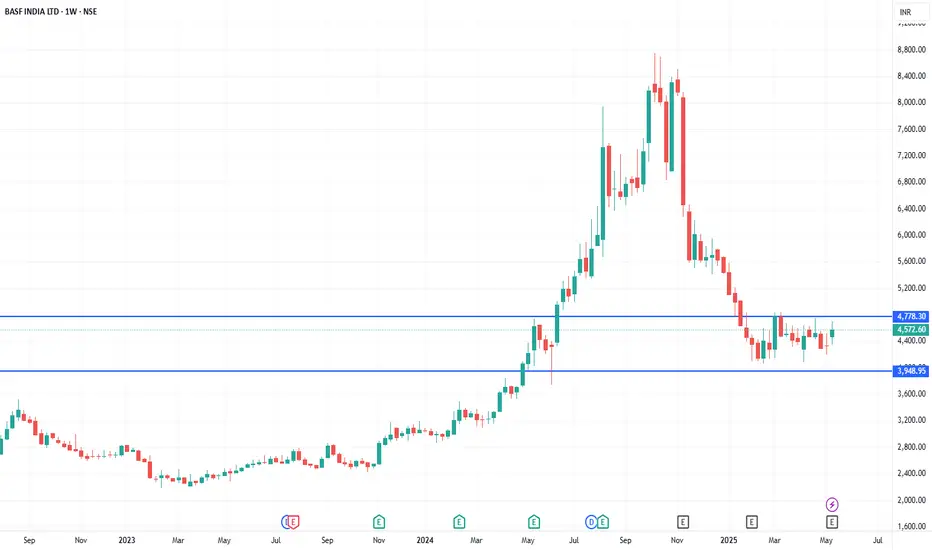
BASF is getting ready to give good return .once it cross 4780 on weekly basis it will give good return
SYMBOL : BASF
CONDITION CLOSE ABOVE 4780 ON WEEKLY
TARGET : 5630
SL: 4040 ON WEEKLY CLOSING BASIS
DISC: THIS IS NOT BUY/SELL RECCOMENDATION.ITS ONLY FOR EDUCATIOL PURPOSE.
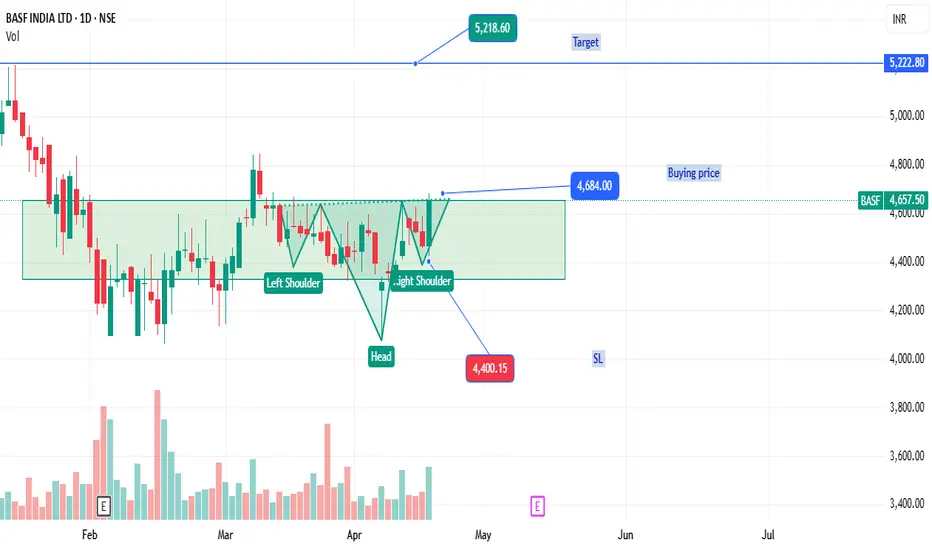
BASF: LONGNSE:BASF
Formed base support, Hammer on 7 Apr 2025 and Bullish candle on 21 Apr 2025, the last bullish candle of 21 Apr has engulf the previous 3 candle with increase in volume, if you look closely, it has also formed Inverted H&S pattern.
All levels are marked on chart
BASFNote:
1. Views are personal and for educational purposes only. Recheck and take the trade as per your RR.
2. Always remember SL is your lifeline, not the big target...
3. Follow us for more patterns and like, share so that we feel it is helpful to many and share more patterns...
3. Views given here


See all ideas
Summarizing what the indicators are suggesting.
Neutral
SellBuy
Strong sellStrong buy
Strong sellSellNeutralBuyStrong buy
Neutral
SellBuy
Strong sellStrong buy
Strong sellSellNeutralBuyStrong buy
Neutral
SellBuy
Strong sellStrong buy
Strong sellSellNeutralBuyStrong buy
An aggregate view of professional's ratings.
Neutral
SellBuy
Strong sellStrong buy
Strong sellSellNeutralBuyStrong buy
Neutral
SellBuy
Strong sellStrong buy
Strong sellSellNeutralBuyStrong buy
Neutral
SellBuy
Strong sellStrong buy
Strong sellSellNeutralBuyStrong buy
Displays a symbol's price movements over previous years to identify recurring trends.
MOSMALL250
Motilal Oswal Nifty Smallcap 250 ETF Units Exchange Traded FundWeight
0.22%
Market value
35.98 K
USD
HESC
HSBC ETFs PLC - HSBC MSCI Emerging Markets Small Cap Screened UCITS ETFWeight
0.04%
Market value
20.11 K
USD
MULTICAP
Mirae Asset Nifty500 Multicap 502525 ETF Exchange Traded Fund UnitsWeight
0.06%
Market value
3.83 K
USD
SMALL250
Mirae Asset Nifty Smallcap 250 ETF Exchange Traded Fund UnitsWeight
0.22%
Market value
3.44 K
USD
Explore more ETFs
Frequently Asked Questions
The current price of BASF is 3,925.70 INR — it has increased by 7.60% in the past 24 hours. Watch BASF India Limited stock price performance more closely on the chart.
Depending on the exchange, the stock ticker may vary. For instance, on NSE exchange BASF India Limited stocks are traded under the ticker BASF.
BASF stock has risen by 7.56% compared to the previous week, the month change is a 4.23% rise, over the last year BASF India Limited has showed a −9.38% decrease.
We've gathered analysts' opinions on BASF India Limited future price: according to them, BASF price has a max estimate of 4,312.00 INR and a min estimate of 4,312.00 INR. Watch BASF chart and read a more detailed BASF India Limited stock forecast: see what analysts think of BASF India Limited and suggest that you do with its stocks.
BASF reached its all-time high on Oct 7, 2024 with the price of 8,750.00 INR, and its all-time low was 64.30 INR and was reached on Apr 12, 2001. View more price dynamics on BASF chart.
See other stocks reaching their highest and lowest prices.
See other stocks reaching their highest and lowest prices.
BASF stock is 8.08% volatile and has beta coefficient of 0.52. Track BASF India Limited stock price on the chart and check out the list of the most volatile stocks — is BASF India Limited there?
Today BASF India Limited has the market capitalization of 158.00 B, it has increased by 0.57% over the last week.
Yes, you can track BASF India Limited financials in yearly and quarterly reports right on TradingView.
BASF India Limited is going to release the next earnings report on Feb 13, 2026. Keep track of upcoming events with our Earnings Calendar.
BASF net income for the last quarter is 1.07 B INR, while the quarter before that showed 1.37 B INR of net income which accounts for −22.02% change. Track more BASF India Limited financial stats to get the full picture.
Yes, BASF dividends are paid annually. The last dividend per share was 20.00 INR. As of today, Dividend Yield (TTM)% is 0.55%. Tracking BASF India Limited dividends might help you take more informed decisions.
BASF India Limited dividend yield was 0.45% in 2024, and payout ratio reached 18.07%. The year before the numbers were 0.45% and 11.53% correspondingly. See high-dividend stocks and find more opportunities for your portfolio.
As of Feb 9, 2026, the company has 4.1 K employees. See our rating of the largest employees — is BASF India Limited on this list?
EBITDA measures a company's operating performance, its growth signifies an improvement in the efficiency of a company. BASF India Limited EBITDA is 6.00 B INR, and current EBITDA margin is 5.23%. See more stats in BASF India Limited financial statements.
Like other stocks, BASF shares are traded on stock exchanges, e.g. Nasdaq, Nyse, Euronext, and the easiest way to buy them is through an online stock broker. To do this, you need to open an account and follow a broker's procedures, then start trading. You can trade BASF India Limited stock right from TradingView charts — choose your broker and connect to your account.
Investing in stocks requires a comprehensive research: you should carefully study all the available data, e.g. company's financials, related news, and its technical analysis. So BASF India Limited technincal analysis shows the buy rating today, and its 1 week rating is sell. Since market conditions are prone to changes, it's worth looking a bit further into the future — according to the 1 month rating BASF India Limited stock shows the buy signal. See more of BASF India Limited technicals for a more comprehensive analysis.
If you're still not sure, try looking for inspiration in our curated watchlists.
If you're still not sure, try looking for inspiration in our curated watchlists.