CDSL for longAfter a great fall from ATH CDSL again looking very good where previously it has witnessed a consolidation breakout and big up move.
CDSL trade ideas


CDSL DAY CHARTCDSL has intermediate support in day @ 990 & 950. After that we have 900 as the support region. I am not Sebi registered advisor. This is my analyse

CDSL WEEKLY CHARTPrimary Trend Line didnt break for the past 3 weeks. Focus this stock if it doesnt broke that trendline. I am not Sebi registered advisor. This is my analyse

CDSLas im posted earlier .
these green lines is very important .
i had given buy signal with the Stoploss of Green Line in mid of april .

CDSL ACCUMULATIONVankkam Makkale this is VIjay. Yep,market is keep on going lower and I'm happy for that because we keep on getting good stocks at lower levels which is goood for investment purposes. And we know that in a longer time frame market ultimately going upside only but it will take some time. So pick your stocks carefully and meaningfully.
We got an oppurtunity to accumulate CDSL for long term purpose. If anybody wish to accumulate #CDSL means kindly start first 30% here or wait for around 1150 level. You may have a question that now only you're giving a fresh entry??. Yes,you're right i already suggested my friends and closed ones to keep cash in hands when we're at 18000. Technically we know how market structure is behaving. So now only i started to giving them a fresh entry buying in stocks but only 30% here because we are very long way to go. But we cant wait for an oppurtunity in particular stocks. So accumulate good sales business and be with them. CHEERS!!
Comment your thoughts below and if you get useful from my post, kindly LIKE,FOLLOW and SHARE to your friends and family.
Thank you for folllowing.

CDSL will light up your portfolio Lower green zone line is the Stop Loss. The red zone lower line is the tgt


Doubletop Pattern at CDSLBe Cautious #Doubletop #Pattern (trend reversal ) at #CDSL weekly chart.
A double top is an extremely bearish technical reversal pattern that forms after an asset reaches a high price two consecutive times with a moderate decline between the two highs. It is confirmed once the asset's price falls below a support level equal to the low between the two prior highs.
ONLY FOR #educational
NOT SEBI REGISTERED. #LEARNEARN (DONT TRUST ANYONE)
#nifty50 #sharemarket #BREAKOUTSTOCKS #Multibagger #sharemarket #sharemarketindia #sensex #technicalanalysis #kukiinvest #Chartanalysis #headandshoulders #doubletop

CDSL - Ready for a breakout!!Time frame - Daily
The stock made a high of 1583 on 12/07/2021 and since then, it has tried to break the level multiple times but failed to do so. While there has been a clear expansion of volume when the stock tried to move up, the stock has also witnessed lower volume during its downtrend. As the broader market has started to recover, I am biased towards making a long position with the below-mentioned levels as my targets and SL
Any long position to be made only after breakout above the level of 1583. I will be investing only 25-30% of my intended capital upon breakout and will wait for a pullback (and confirmation) to invest the remaining capital
T1 - 1980
T2 - 2130
SL - 1300
Disclaimer - The above idea is just for educational purposes, I am not certified to give any buy/sell call.
Do follow the account if the article delivered value to you :)
CDSL at Short term crucial support1) support zone tested for almost 6 times
2) closing is important
3) we can witness a one way rise or fall from here

CDSLCDSL been in a accumulating phase for more than 5 months now A breakout above 1600 levels with volume can trigger a new leg of upmove for shorter term.
Happy Trading :)
Disc: Chart posted only for learning purpose.

BACK TO BACK 2 BULLISH PATTERNS - DOUBLE BOTTOM & BULLISH FLAGDouble Bottom and then Bullish Flag BO
- From 17 Jan to 24 Feb stock was under pressure of supply.
- After making low of 1282 on 24th Feb, stock price advanced up to 11.71%. This shows the first signal of double bottom.
- After this 2nd low of 1311 created on 7Mar-8Mar and Double Bottom has been confirmed on 10th of March.
- By 15th March, it advanced up to 286 points (which is approx. 22% upside rally) & on same day again starts falling down till 1248 on 30th March.
- Now, A fresh new pattern is created and that is Bullish flag pattern with BO on preceding day.
TGTs are mentioned in chart area

CDSL BIG breakout coming soon cdsl is ready to give big returns like before . if cdsl sustain above blue line then it will be best for swing trade ....
buy above 1503 - 1510
strict stoploss - 1440

CDSLNSE:CDSL
please note that we are not a SEBI Registered Investor Adviser/PMS/ Broking House.
All the contents over here are for educational purposes only and are not investment advice or recommendations
offered to any person(s) with respect to the purchase or sale of the stocks / futures and options.
You are also requested to apply your prudence and consult your advisers in case you choose to act on
any such content available as WE claims no responsibilities for any of your actions or any outcome of
such action

CDSL Chart for swing TradingHey, Guys Plz check! Correct me if I am wrong.
Long on CDSL for swing Trading

CDSL CDSL, the stock never tested 20 day EMA within one year until TODAY, Its a conditional sell as the candle has still not given closing , so when the candle gets closed below 20DEMA or gets a negative weekly closing, a downside of next 50 DAY EMA doors gets opened and the same level is the weekly support of the support.
DISCLAIMER - I AM NOT A FINANCIAL ADVISOR, ITS JUST A VIEW AND NOT AN ADVISE.

A trendline breakdown keep an eyeTrendline from May 2021 has been broken on 24th January but breakdown candle was not a high volume candle so it might go in sideways
Also i am seeing taking support on 100EMA line a close below 100EMA line or a close below 1420-1400 can open a way for more downside

CDSL - LONGCDSL - On an Uptrend - Price 1467
Has been Consolidating around the same area for the past 5 months
Cleared a small resistance .
Major resistance around 1600 .
Can add with DCB of below 1280

CDSL NEAR SUPPORT LEVELFor the past 4-5 months CDSL is trading in a parallel channel recently it had broken it but then rises back the lower band level. Now one more time it has been broken and now it is near to its horizontal support (major support). This support has been previously acted as a resistance level and recently as a support.
Considering the above signs, It can act as major support here and we may see a reversal from here (Considering todays closing). Target can be taken as a lower band of parallel channel. Refer chart for a clear view of my thoughts.
Thank you for reading.

Another BO Attempt at long consolidation rangeAnother BO Attempt at long consolidation range.
Keep an eye

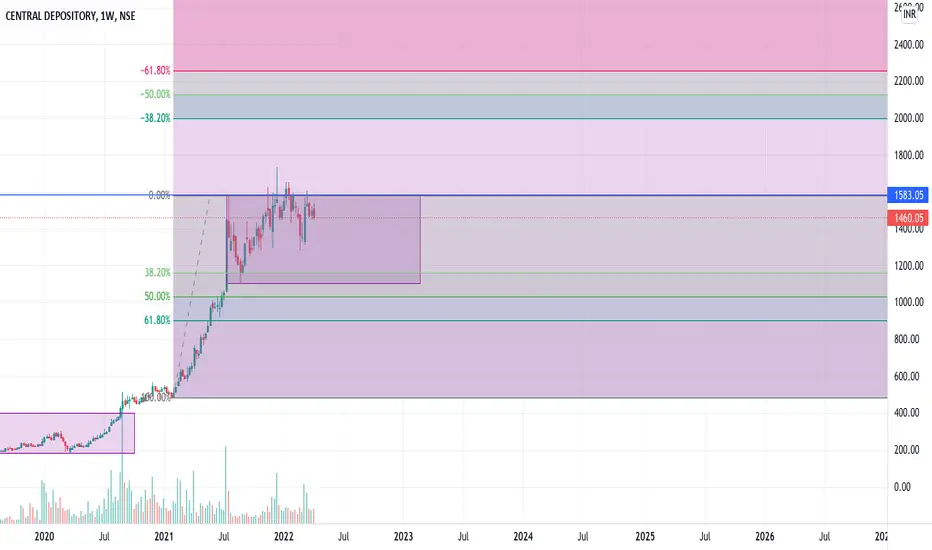
CDSL going to touch 1900 level soonOn the Weekly chart, the Share breaks the major resistant level near 1500. After more than 4 months of Staying between range and breaking it on a weekly level. If he holds it and momentum continues as per the chart then it going to test again at 190 levels in the near future on the basis of Fibo. level.
Short term target is 1640 from the current level
Long term target is 1900 in 6 months
