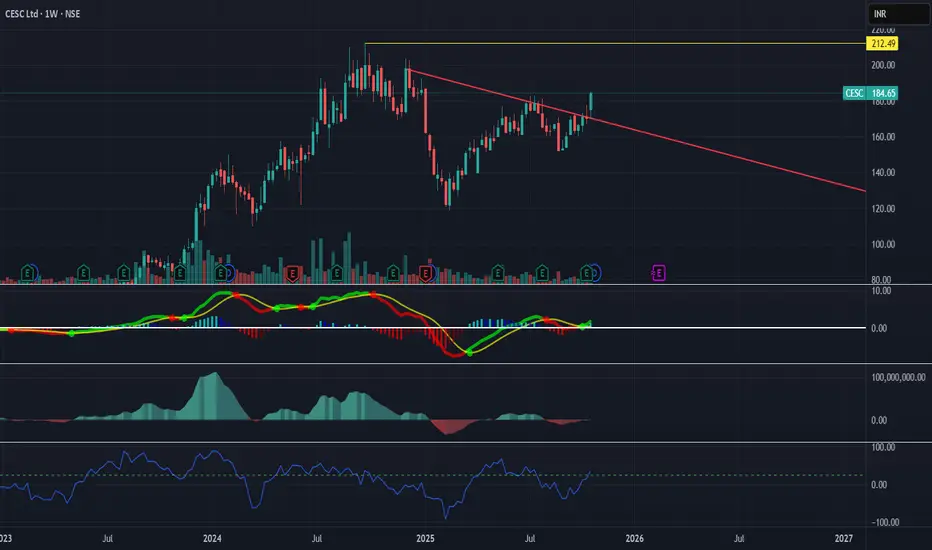
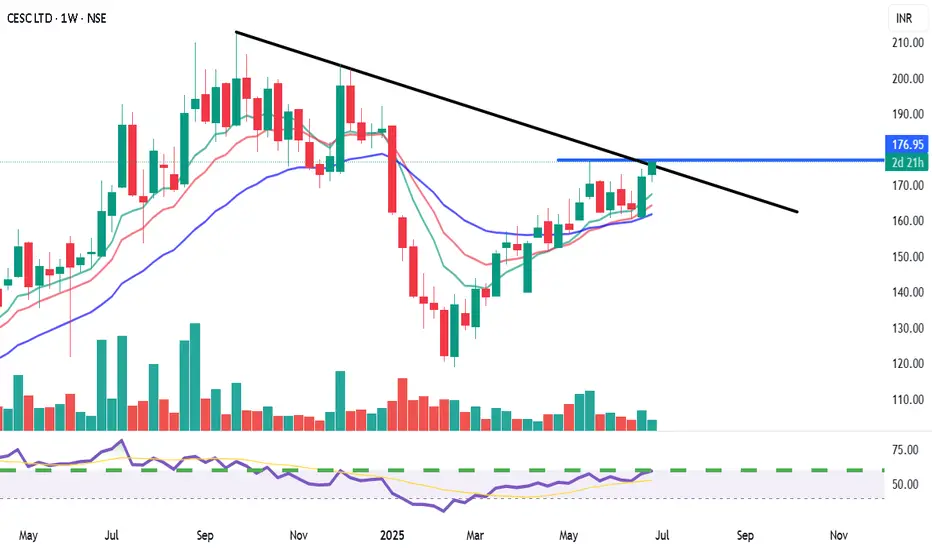
CESC - Chart of the Week⚡ CESC LTD – Trendline Breakout on Weekly Chart
Chart Type: Weekly (1W)
CMP: ₹184.65
Breakout Zone: ₹180–₹185
Next Target: ₹212
Support Zone: ₹165–₹170
📊 Technical View:
CESC has broken out of a long-term falling trendline with strong bullish candles and volume pickup.
MACD bullish crossover con
Next report date
—
Report period
—
EPS estimate
—
Revenue estimate
—
11.09 INR
13.69 B INR
169.44 B INR
657.89 M
About CESC Ltd
Sector
Industry
Website
Headquarters
Kolkata
Founded
1899
IPO date
Nov 3, 1994
Identifiers
2
ISIN INE486A01021
CESC Ltd. engages in the generation and distribution of electricity. Its projects include Chandrapur and Haldia Thermal Plant. The company was founded in 1899 and is headquartered in Kolkata, India.
Related stocks
Good Bullish move Price is triggered due to dividend distribution. good area to buy for bullish move.
Go long with Sl to be calculated as per the risk appetite.

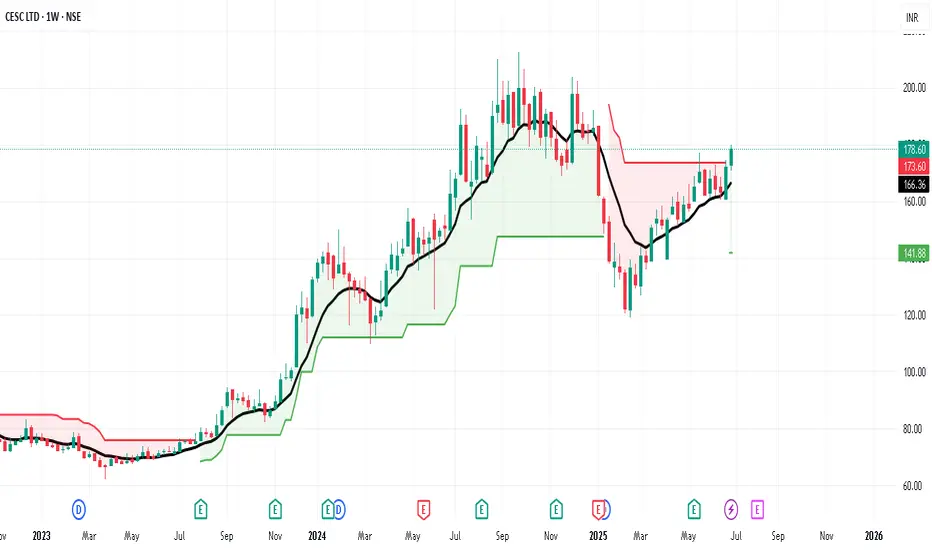
CESCCESC cup and handle pattern on weekly timeframe, buy for target with strict stoploss as shown in chart.

Taking CE of 162.5This seems like it broke all levels and a bounce back to the line indicated can happen
Monthly expiry is a way to play it
I chose 162.5 CE at 5.5

Positional or longterm opportunity in CESCGo Long @ 139.6 for Targets of 165, 185.8, and 276.5 with SL 124.2
Reasons to go Long :
1. On a Weekly timeframe if we draw the Fibonacci retracement tool from the recent swing low (point A) to the recent swing high (point B) then we see stock took support from the 0.618 Fibonacci level.
2. Besid

Long CESC
SuperTrend has turned positive on the weekly chart, with the recent closing price trading above the 10 EMA
BUY CESC
Entry - 180
SL - 166
CESC Swing Setup | Entry ₹174–178 | Target ₹182 / ₹194 | SL ₹168✅ Swing Trading Plan for CESC Ltd
🟢 **Structure:**
• Daily breakout continuation with fresh momentum
• EMA cluster support near ₹170
• Good volume expansion
🎯 **Entry Zone:** ₹174–₹178
🛡️ **Stop Loss:** ₹168 (daily close)
🏁 **Target 1:** ₹182
🏁 **Target 2:** ₹194
⚡ **Confidence
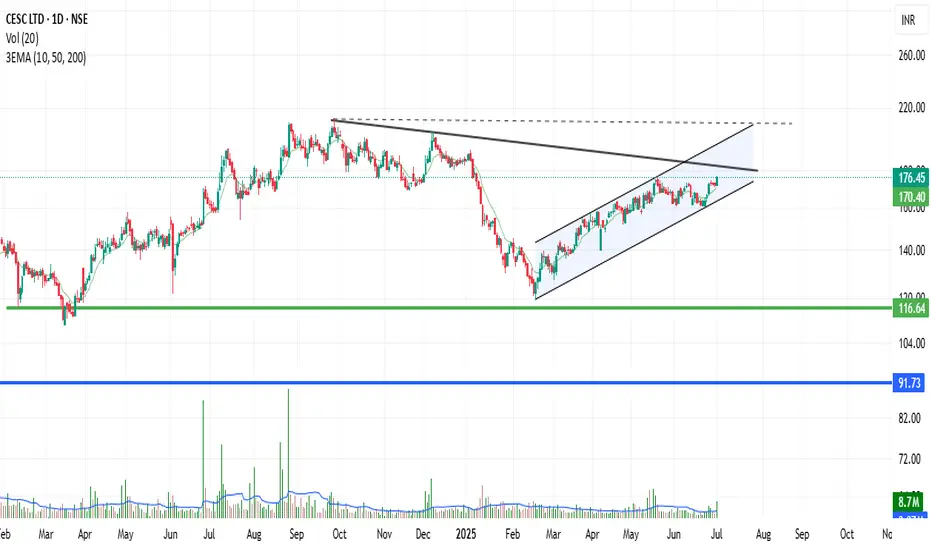
Cesc Limited (CESC)📊 Chart Overview:
Current Price: ₹176.45 (↑ +2.74%)
Price all 3EMA (10, 50, 200) above → Currently around ₹170.40
Volume: Significant recent spike at 8.7M, above 20-day average volume (3.37M)
Trend Pattern: Ascending channel (marked), approaching major resistance zone
Trend & Structure:
Uptrend wi
CESC Ltd. (NSE: CESC) - Weekly Chart AnalysisView: Bullish on confirmed breakout.
Bias: Positive momentum.
Strategy:
BUY: Above ₹178-180 (on weekly closing basis, confirming trendline and resistance breakout).
Targets (T):
T1: ₹195-200
T2: ₹210-220+
Stop-Loss (SL): ₹168 (on weekly closing basis).
Reasoning:
Attempting a breakout from a
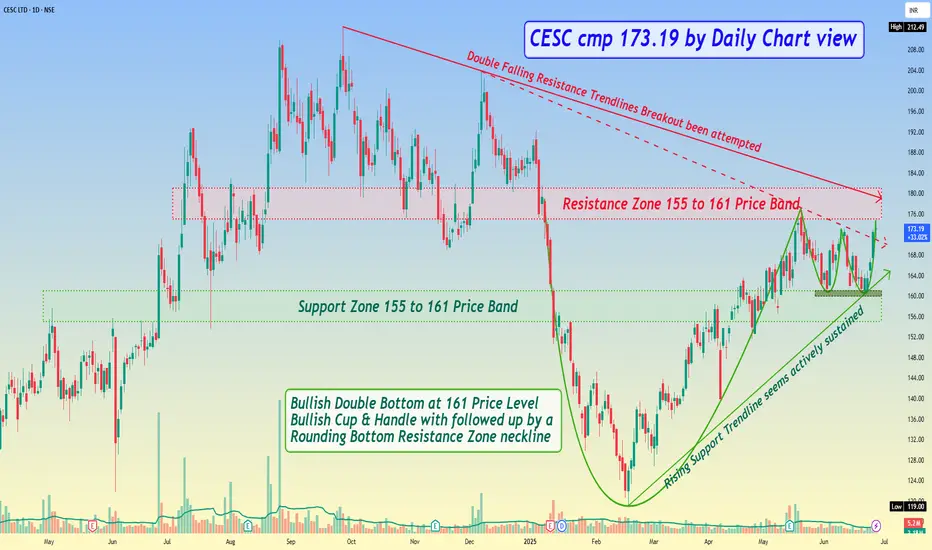
*CESC cmp 173.19 by Daily Chart view**CESC cmp 173.19 by Daily Chart view*
- Support Zone 155 to 161 Price Band
- Resistance Zone 155 to 161 Price Band
- Bullish Double Bottom at 161 Price Level
- Rising Support Trendline seems actively sustained
- Volumes spiking seen in sync with the avg traded quantity
- Double Falling Resistance
See all ideas
Summarizing what the indicators are suggesting.
Neutral
SellBuy
Strong sellStrong buy
Strong sellSellNeutralBuyStrong buy
Neutral
SellBuy
Strong sellStrong buy
Strong sellSellNeutralBuyStrong buy
Neutral
SellBuy
Strong sellStrong buy
Strong sellSellNeutralBuyStrong buy
An aggregate view of professional's ratings.
Neutral
SellBuy
Strong sellStrong buy
Strong sellSellNeutralBuyStrong buy
Neutral
SellBuy
Strong sellStrong buy
Strong sellSellNeutralBuyStrong buy
Neutral
SellBuy
Strong sellStrong buy
Strong sellSellNeutralBuyStrong buy
Displays a symbol's price movements over previous years to identify recurring trends.
Frequently Asked Questions
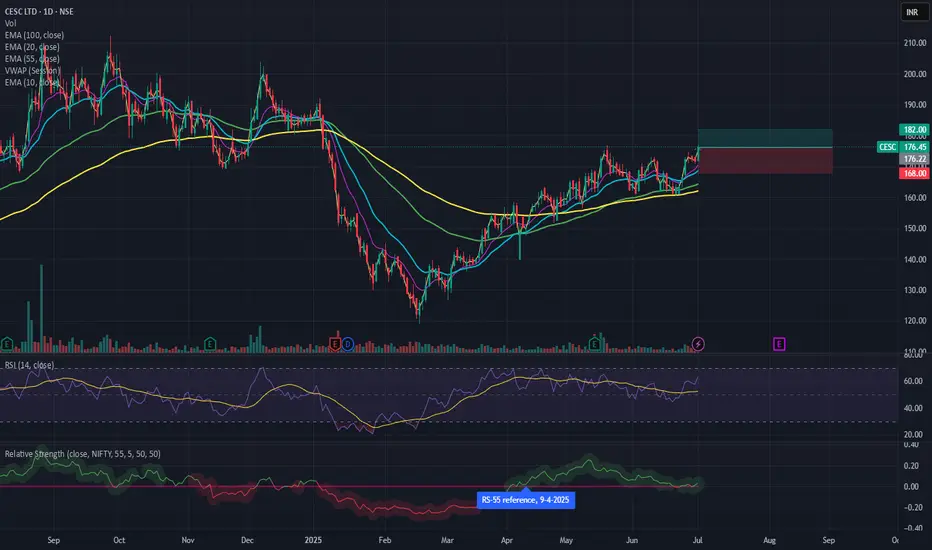
The current price of CESC is 154.06 INR — it has decreased by −1.21% in the past 24 hours. Watch CESC Ltd stock price performance more closely on the chart.
Depending on the exchange, the stock ticker may vary. For instance, on NSE exchange CESC Ltd stocks are traded under the ticker CESC.
CESC stock has risen by 0.88% compared to the previous week, the month change is a −6.10% fall, over the last year CESC Ltd has showed a 19.58% increase.
We've gathered analysts' opinions on CESC Ltd future price: according to them, CESC price has a max estimate of 250.00 INR and a min estimate of 160.00 INR. Watch CESC chart and read a more detailed CESC Ltd stock forecast: see what analysts think of CESC Ltd and suggest that you do with its stocks.
CESC reached its all-time high on Sep 26, 2024 with the price of 212.49 INR, and its all-time low was 0.70 INR and was reached on Feb 6, 2002. View more price dynamics on CESC chart.
See other stocks reaching their highest and lowest prices.
See other stocks reaching their highest and lowest prices.
CESC stock is 2.16% volatile and has beta coefficient of 1.70. Track CESC Ltd stock price on the chart and check out the list of the most volatile stocks — is CESC Ltd there?
Today CESC Ltd has the market capitalization of 206.59 B, it has increased by 4.78% over the last week.
Yes, you can track CESC Ltd financials in yearly and quarterly reports right on TradingView.
CESC Ltd is going to release the next earnings report on May 27, 2026. Keep track of upcoming events with our Earnings Calendar.
CESC net income for the last quarter is 2.85 B INR, while the quarter before that showed 4.25 B INR of net income which accounts for −32.94% change. Track more CESC Ltd financial stats to get the full picture.
CESC Ltd dividend yield was 2.93% in 2024, and payout ratio reached 43.57%. The year before the numbers were 3.71% and 43.34% correspondingly. See high-dividend stocks and find more opportunities for your portfolio.
As of Feb 12, 2026, the company has 5.69 K employees. See our rating of the largest employees — is CESC Ltd on this list?
EBITDA measures a company's operating performance, its growth signifies an improvement in the efficiency of a company. CESC Ltd EBITDA is 35.16 B INR, and current EBITDA margin is 16.43%. See more stats in CESC Ltd financial statements.
Like other stocks, CESC shares are traded on stock exchanges, e.g. Nasdaq, Nyse, Euronext, and the easiest way to buy them is through an online stock broker. To do this, you need to open an account and follow a broker's procedures, then start trading. You can trade CESC Ltd stock right from TradingView charts — choose your broker and connect to your account.
Investing in stocks requires a comprehensive research: you should carefully study all the available data, e.g. company's financials, related news, and its technical analysis. So CESC Ltd technincal analysis shows the sell today, and its 1 week rating is sell. Since market conditions are prone to changes, it's worth looking a bit further into the future — according to the 1 month rating CESC Ltd stock shows the neutral signal. See more of CESC Ltd technicals for a more comprehensive analysis.
If you're still not sure, try looking for inspiration in our curated watchlists.
If you're still not sure, try looking for inspiration in our curated watchlists.