CGPOWER: Major Rebound or Supply Trap?CGPOWER has staged a stunning recovery from recent lows, fueled by a robust Q3 Earnings beat and a massive 62% YoY jump in its order backlog (now at ₹15,753 Cr!).
While the fundamentals are firing, the technicals are at a crossroads.
📉 The "Supply Wall" Challenge
The Zone: 581 – 591
This is a histo
CG Power & Industrial Solutions Ltd
No trades
Next report date
—
Report period
—
EPS estimate
—
Revenue estimate
—
7.15 INR
9.75 B INR
99.09 B INR
685.23 M
About CG Power & Industrial Solutions Ltd
Sector
Industry
CEO
Amar Kaul
Website
Headquarters
Mumbai
Founded
1937
IPO date
Nov 15, 1994
Identifiers
2
ISIN INE067A01029
CG Power & Industrial Solutions Ltd. engages in the design and manufacture of power conversion equipment products. It operates through the Power Systems and Industrial Systems segments. The Power Systems segment includes transformer, switchgear, and turnkey projects. The Industrial Systems segment offers electric motors, alternators, drives, and traction electronics. The company was founded on April 28, 1937 and is headquartered in Mumbai, India.
Related stocks

CG Power: A 5% Jump Inside a Bigger CorrectionThe recent 5% move on a positive order win looks encouraging, but the price structure remains corrective . From an Elliott Wave perspective, this is not the time to chase strength .
From the ₹874.70 high , CG Power entered a complex correction . The first leg down, Wave (W) , unfolded as an A

CGPOWER 1 Day Time Frame📊 Daily Price Levels (1D Time Frame)
Current price range (recent session)
• Day’s trading range ~ ₹634–₹651 approx on NSE (latest close ~ ₹637–₹647) (as per recent data)
Pivot / Pivot‑based levels
• Daily Pivot: ~ ₹662 (central reference)
(use this as a neutral baseline — above favors bullish bias

ShortOnly Trendlines Used — No Other Confluence
⦁ Stoploss Is Based on the Trendline
⦁ Retest of Trendline Builds Confidence
⦁ Trendline Angle Shows Momentum
⦁ Trendlines Define Risk Clearly

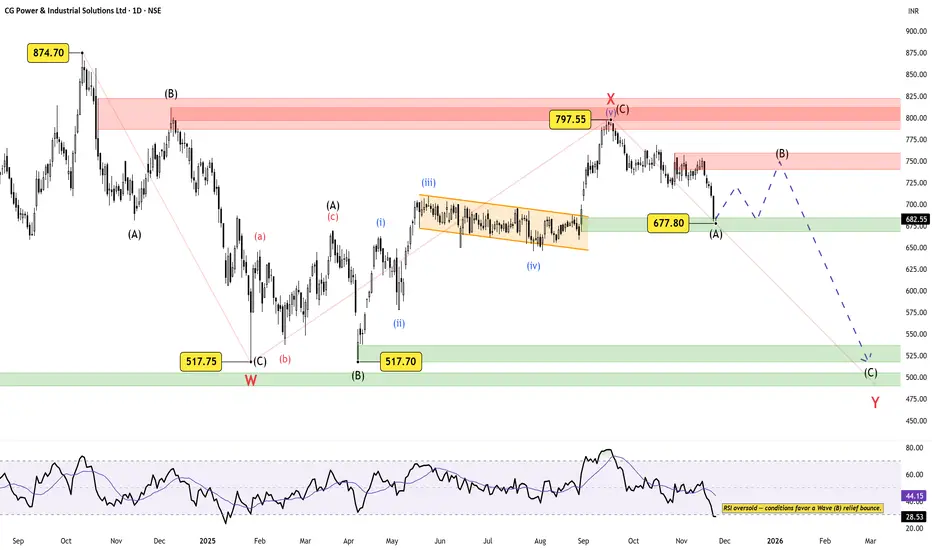
CG Power: Technical Correction vs Strong FundamentalsCG Power has reacted sharply from the 797–800 zone, confirming a reversal from the prior up-leg.
The decline into 677.80 has unfolded as a clean impulsive drop, which fits well as Wave (A) of the larger Wave Y.
With RSI oversold, the market is now in a zone where a corrective Wave (B) bounce become
CGPOWER 1 Month Time Frame 🔍 Current snapshot
Last close around ₹723.85.
52-week low ≈ ₹517.70, 52-week high ≈ ₹811.40.
Technical indicators show: 20 day SMA around ~₹746, 100 day SMA ~₹705.86.
🎯 My Outlook / Scenario Planning
Base case: The stock trades between ~₹716 and ~₹740 over the next month, oscillating around t

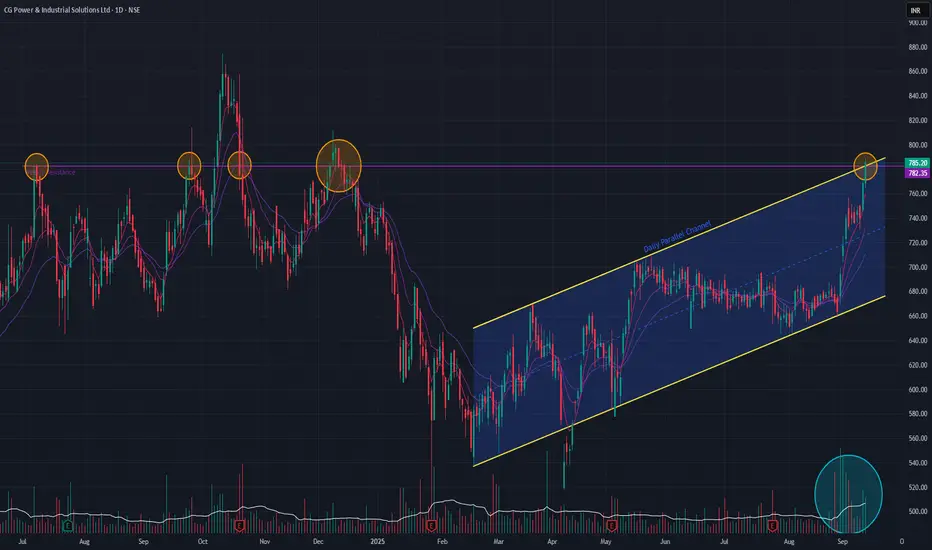
CG POWER SWING ANALYSIS Stats shown here is based on trend line, cgpower is in uptrend going upside in channel.
here many times created fake breakout and breadown.
I mentioned here support an resistances,bigger green line is my observation and i hope it will test this support if resistance placed just above will n
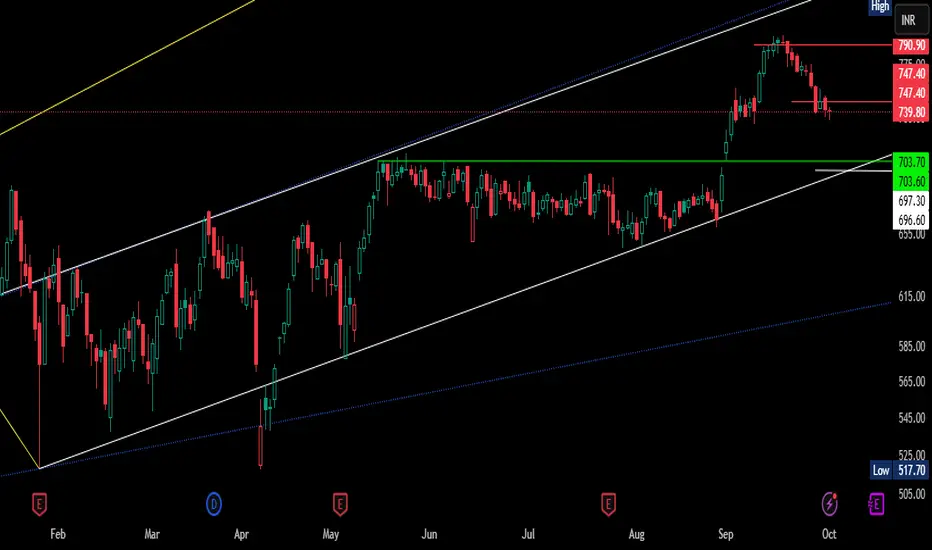
CG Power (Daily Timeframe) - Potential BreakOut CG Power has been consolidating below a major horizontal resistance line established in July 2024, which has so far prevented new all-time highs. Following a downtrend that began in October 2024, the stock has been trading within a well-defined parallel channel.
Today's price action is particularly
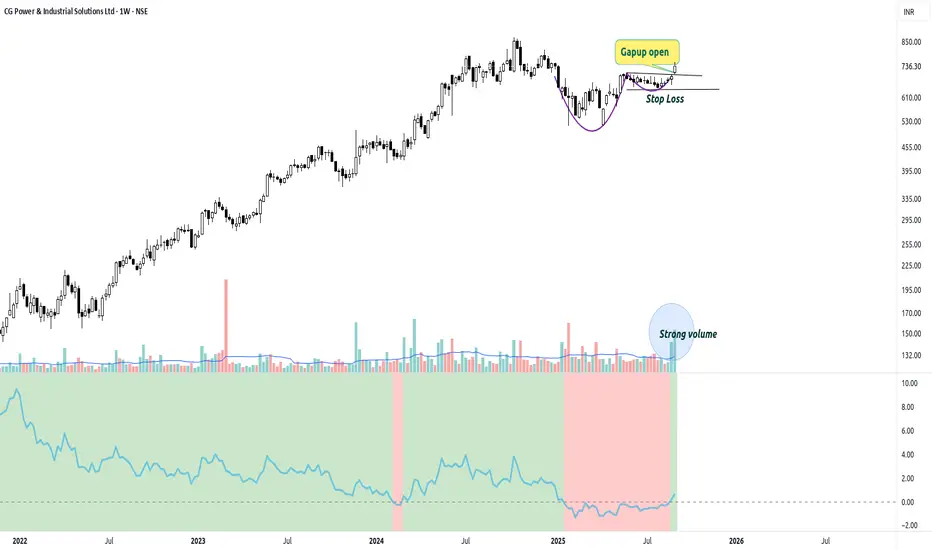
G Power – Weekly Breakout with Gap-Up and Strong VolumeTechnical View:
Stock has given a decisive breakout on the weekly chart, accompanied by a gap-up opening, which adds conviction.
Volume spike indicates strong institutional demand backing the move.
Relative strength vs Nifty has turned positive, showing clear outperformance compared to the br
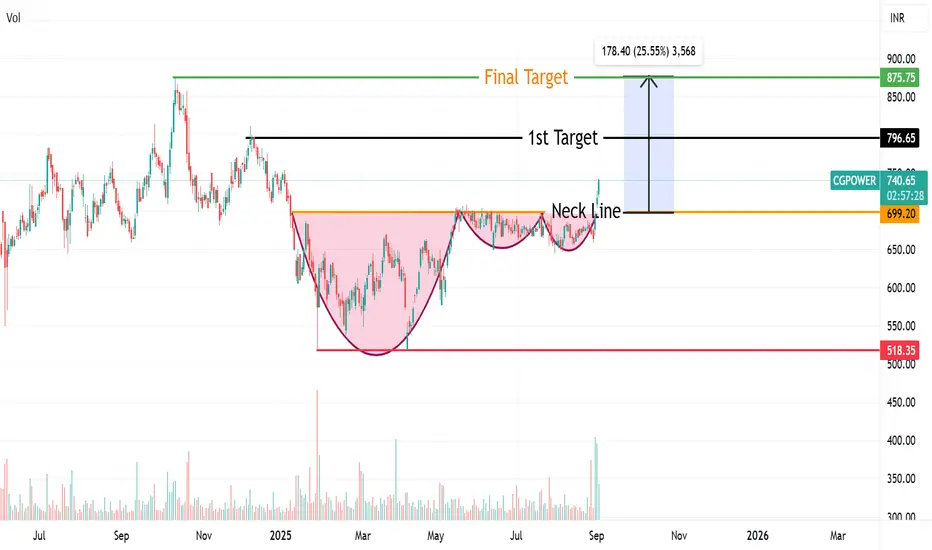
Complex Cup & Handle Pattern breakout in CG PowerCG Power given breakout of Complex Cup & Handle Pattern from neckline arround 700 level. Final target of it will 875 level & Near term target will be 796 level with a stoploss of 680 Rs.
it's not a buy or sell call ...just for education
See all ideas
Summarizing what the indicators are suggesting.
Neutral
SellBuy
Strong sellStrong buy
Strong sellSellNeutralBuyStrong buy
Neutral
SellBuy
Strong sellStrong buy
Strong sellSellNeutralBuyStrong buy
Neutral
SellBuy
Strong sellStrong buy
Strong sellSellNeutralBuyStrong buy
An aggregate view of professional's ratings.
Neutral
SellBuy
Strong sellStrong buy
Strong sellSellNeutralBuyStrong buy
Neutral
SellBuy
Strong sellStrong buy
Strong sellSellNeutralBuyStrong buy
Neutral
SellBuy
Strong sellStrong buy
Strong sellSellNeutralBuyStrong buy
Displays a symbol's price movements over previous years to identify recurring trends.
Frequently Asked Questions
The current price of CGPOWER is 688.75 INR — it has increased by 1.33% in the past 24 hours. Watch CG Power & Industrial Solutions Ltd stock price performance more closely on the chart.
Depending on the exchange, the stock ticker may vary. For instance, on NSE exchange CG Power & Industrial Solutions Ltd stocks are traded under the ticker CGPOWER.
CGPOWER stock has risen by 1.40% compared to the previous week, the month change is a 19.77% rise, over the last year CG Power & Industrial Solutions Ltd has showed a 18.36% increase.
We've gathered analysts' opinions on CG Power & Industrial Solutions Ltd future price: according to them, CGPOWER price has a max estimate of 900.00 INR and a min estimate of 472.00 INR. Watch CGPOWER chart and read a more detailed CG Power & Industrial Solutions Ltd stock forecast: see what analysts think of CG Power & Industrial Solutions Ltd and suggest that you do with its stocks.
CGPOWER reached its all-time high on Oct 11, 2024 with the price of 874.70 INR, and its all-time low was 4.75 INR and was reached on Mar 13, 2020. View more price dynamics on CGPOWER chart.
See other stocks reaching their highest and lowest prices.
See other stocks reaching their highest and lowest prices.
CGPOWER stock is 2.14% volatile and has beta coefficient of 1.83. Track CG Power & Industrial Solutions Ltd stock price on the chart and check out the list of the most volatile stocks — is CG Power & Industrial Solutions Ltd there?
Today CG Power & Industrial Solutions Ltd has the market capitalization of 1.07 T, it has increased by 4.32% over the last week.
Yes, you can track CG Power & Industrial Solutions Ltd financials in yearly and quarterly reports right on TradingView.
CG Power & Industrial Solutions Ltd is going to release the next earnings report on May 30, 2026. Keep track of upcoming events with our Earnings Calendar.
CGPOWER earnings for the last quarter are 1.81 INR per share, whereas the estimation was 1.94 INR resulting in a −6.61% surprise. The estimated earnings for the next quarter are 1.83 INR per share. See more details about CG Power & Industrial Solutions Ltd earnings.
CG Power & Industrial Solutions Ltd revenue for the last quarter amounts to 31.75 B INR, despite the estimated figure of 31.70 B INR. In the next quarter, revenue is expected to reach 33.88 B INR.
CGPOWER net income for the last quarter is 2.85 B INR, while the quarter before that showed 2.87 B INR of net income which accounts for −0.66% change. Track more CG Power & Industrial Solutions Ltd financial stats to get the full picture.
CG Power & Industrial Solutions Ltd dividend yield was 0.20% in 2024, and payout ratio reached 20.39%. The year before the numbers were 0.24% and 13.91% correspondingly. See high-dividend stocks and find more opportunities for your portfolio.
As of Feb 17, 2026, the company has 4.84 K employees. See our rating of the largest employees — is CG Power & Industrial Solutions Ltd on this list?
EBITDA measures a company's operating performance, its growth signifies an improvement in the efficiency of a company. CG Power & Industrial Solutions Ltd EBITDA is 15.02 B INR, and current EBITDA margin is 13.52%. See more stats in CG Power & Industrial Solutions Ltd financial statements.
Like other stocks, CGPOWER shares are traded on stock exchanges, e.g. Nasdaq, Nyse, Euronext, and the easiest way to buy them is through an online stock broker. To do this, you need to open an account and follow a broker's procedures, then start trading. You can trade CG Power & Industrial Solutions Ltd stock right from TradingView charts — choose your broker and connect to your account.
Investing in stocks requires a comprehensive research: you should carefully study all the available data, e.g. company's financials, related news, and its technical analysis. So CG Power & Industrial Solutions Ltd technincal analysis shows the buy rating today, and its 1 week rating is strong buy. Since market conditions are prone to changes, it's worth looking a bit further into the future — according to the 1 month rating CG Power & Industrial Solutions Ltd stock shows the strong buy signal. See more of CG Power & Industrial Solutions Ltd technicals for a more comprehensive analysis.
If you're still not sure, try looking for inspiration in our curated watchlists.
If you're still not sure, try looking for inspiration in our curated watchlists.