Cholafin Long - Investment Ideas & AnalysisTechnical Analysis : Cholamandalam Investment and Finance Co. Ltd.
Current Price: 1,610.30
Multi-Timeframe Technical Analysis
Weekly Timeframe Pattern
The stock has formed a **Cup and Handle** pattern on the weekly chart, which is traditionally considered a bullish continuation pattern. This pat
Next report date
—
Report period
—
EPS estimate
—
Revenue estimate
—
55.25 INR
42.63 B INR
258.55 B INR
424.45 M
About Cholamandalam Investment and Finance Co. Ltd.
Sector
Industry
CEO
Ravindra Kumar Kundu
Website
Headquarters
Chennai
Founded
1978
ISIN
INE121A01024
FIGI
BBG000CQ08Y3
Cholamandalam Investment & Finance Co. Ltd. engages in the provision of financial services. It operates through the following segments: Vehicle Finance Loans, Loan Against Property, Home Loans, and Other Loans. The Vehicle Finance Loans segment includes loans to customers against purchase of new/used vehicles, tractors, construction equipment, and loan to automobile dealers. The Home Loans segment includes loans given for acquisition of residential property. The Loan Against Property segment includes loans to customer against immovable property. The Other Loans segment involves loans against shares and other unsecured loans. The company was founded on August 17, 1978 and is headquartered in Chennai, India.
Related stocks

Cholamandalam Financial Holdings Ltd (CFHL) Triangle Breakout 1DCholamandalam Financial Holdings Ltd (CFHL) – Triangle Breakout & 1-Year Resistance Breakout 🚀
📊 Technical View:
CFHL has given a triangle breakout along with a 1-year resistance breakout, indicating strong bullish momentum. If Trend continues, The price action also shows a successful retest of

Short sell the 1st Move down This is an indication of weakness after making New ATH
We are Looking for short sell in Futures based on pattern
This is education content
Good luck

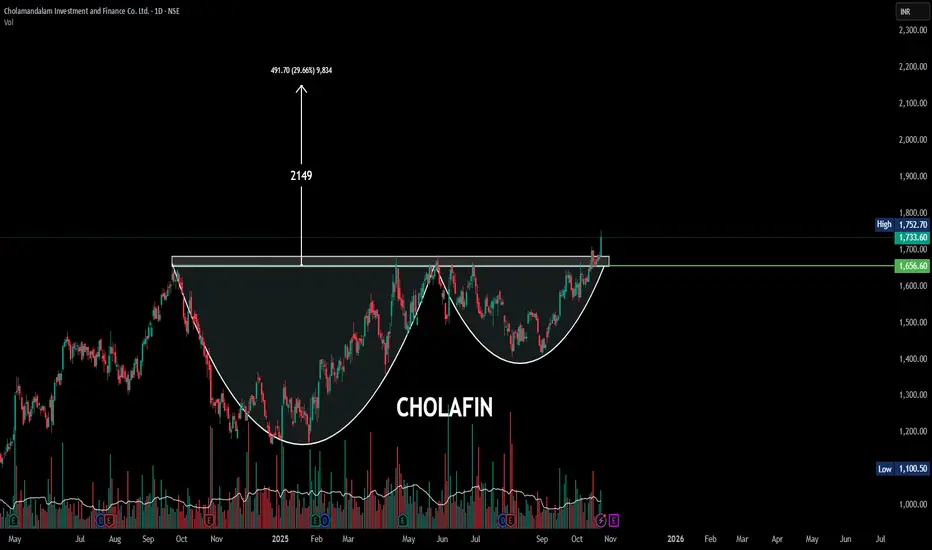
CHOLAFIN| ! Cup and Handle pattern | DailyThe chart displays a confirmed Cup and Handle pattern, which is a highly bullish continuation pattern.
Pattern: Cup and Handle (Daily Chart).Breakout: The price has successfully broken out above the pattern's resistance level (the lip of the cup) at approximately $₹1,656.60. This move is typically
CHOLAFIN 1 Day Time Frame 📊 Current Snapshot
Latest closing around ₹1,733.60 on 24 Oct 2025.
Day’s range on that date: high ~ ₹1,752.70, low ~ ₹1,678.10.
52-week range: ~ ₹1,168 (low) to ~ ₹1,708 (high) as per latest data.

Cholamandalam Investment & Finance Co. Ltd. (CHOLAFIN) – WeeklyPattern Identified: Cup & Handle Breakout
CMP: ₹1,709.70
Timeframe: Weekly
After months of consolidation, CHOLAFIN has confirmed a Cup & Handle breakout above ₹1,700 with strong bullish momentum.
Technical Highlights:
Breakout Zone: ₹1,680–₹1,700
Support Zone: ₹1,650 (former resistance)
The st

ATH breakoutAll time High Breakout.
Deliveries are > 75%
Price can see the new highs. keep on watch
This is only educational purpose no any trade recommendation.

CHOLAFIN Technical & Trade AnalysisCHOLAFIN Technical & Trade Analysis
1️⃣ Price Action
CHOLAFIN surged +4.31% to close at ₹1,583.10, marking a strong bullish candle on the daily chart. Price action shows a clean breakout attempt, with momentum reclaiming higher zones. The stock is now eyeing ₹1,662 → ₹1,737 → ₹1,845 as upside target

Buy the dip CholaFin CMP 1509
Elliott - the next tgt for the counter is at 1950. Since all the swings will get exhausted a bigger three wave correction will unfold once the stock meets the tgt.
Candlestick - the huge wicks on the top on several candles is an indication of selling pressure on the previous

Sell Chola Finance
Chola finance had completed Wave III and was forming a flat structure, wave A and Wave B of the structure have been completed which are three wave structures.
Wave C is in progress which is a five wave structure.
Target 1 x of Wave A.

See all ideas
Summarizing what the indicators are suggesting.
Neutral
SellBuy
Strong sellStrong buy
Strong sellSellNeutralBuyStrong buy
Neutral
SellBuy
Strong sellStrong buy
Strong sellSellNeutralBuyStrong buy
Neutral
SellBuy
Strong sellStrong buy
Strong sellSellNeutralBuyStrong buy
An aggregate view of professional's ratings.
Neutral
SellBuy
Strong sellStrong buy
Strong sellSellNeutralBuyStrong buy
Neutral
SellBuy
Strong sellStrong buy
Strong sellSellNeutralBuyStrong buy
Neutral
SellBuy
Strong sellStrong buy
Strong sellSellNeutralBuyStrong buy
Displays a symbol's price movements over previous years to identify recurring trends.
1088CIFPER
Cholamandalam Investment and finance Company Limited 10.88% PERPYield to maturity
9.65%
Maturity date
—
10CIFPERP
Cholamandalam Investment and finance Company Limited 10.75% PERPYield to maturity
9.04%
Maturity date
—
84CIFCL28
Cholamandalam Investment and finance Company Limited 8.4% 09-AUG-2028Yield to maturity
7.54%
Maturity date
Aug 9, 2028
CIFCZC26
Cholamandalam Investment and finance Company Limited 0.0% 07-DEC-2026Yield to maturity
7.38%
Maturity date
Dec 7, 2026
85CIFC27
Cholamandalam Investment and finance Company Limited 8.5% 31-JAN-2027Yield to maturity
6.94%
Maturity date
Jan 31, 2027
840CIFCL28
Cholamandalam Investment and finance Company Limited 8.4% 04-MAY-2028Yield to maturity
6.32%
Maturity date
May 4, 2028
86CIFC29
Cholamandalam Investment and finance Company Limited 8.6% 31-JAN-2029Yield to maturity
6.08%
Maturity date
Jan 31, 2029
860CIFCL28
Cholamandalam Investment and finance Company Limited 8.6% 07-DEC-2028Yield to maturity
5.73%
Maturity date
Dec 7, 2028
925IHFL25E
Cholamandalam Investment and finance Company Limited 8.3% 09-SEP-2026Yield to maturity
5.54%
Maturity date
Sep 9, 2026
850CIFCL26
Cholamandalam Investment and finance Company Limited 8.5% 07-DEC-2026Yield to maturity
4.61%
Maturity date
Dec 7, 2026
830CIFC26
Cholamandalam Investment and finance Company Limited 8.3% 04-JUN-2026Yield to maturity
1.27%
Maturity date
Jun 4, 2026
See all CHOLAFIN bonds
Frequently Asked Questions
The current price of CHOLAFIN is 1,680.70 INR — it has increased by 0.41% in the past 24 hours. Watch Cholamandalam Investment and Finance Co. Ltd. stock price performance more closely on the chart.
Depending on the exchange, the stock ticker may vary. For instance, on NSE exchange Cholamandalam Investment and Finance Co. Ltd. stocks are traded under the ticker CHOLAFIN.
CHOLAFIN stock has fallen by −2.17% compared to the previous week, the month change is a −2.58% fall, over the last year Cholamandalam Investment and Finance Co. Ltd. has showed a 29.28% increase.
We've gathered analysts' opinions on Cholamandalam Investment and Finance Co. Ltd. future price: according to them, CHOLAFIN price has a max estimate of 1,980.00 INR and a min estimate of 1,270.00 INR. Watch CHOLAFIN chart and read a more detailed Cholamandalam Investment and Finance Co. Ltd. stock forecast: see what analysts think of Cholamandalam Investment and Finance Co. Ltd. and suggest that you do with its stocks.
CHOLAFIN reached its all-time high on Oct 27, 2025 with the price of 1,782.00 INR, and its all-time low was 21.30 INR and was reached on Dec 22, 2011. View more price dynamics on CHOLAFIN chart.
See other stocks reaching their highest and lowest prices.
See other stocks reaching their highest and lowest prices.
CHOLAFIN stock is 0.93% volatile and has beta coefficient of 1.48. Track Cholamandalam Investment and Finance Co. Ltd. stock price on the chart and check out the list of the most volatile stocks — is Cholamandalam Investment and Finance Co. Ltd. there?
Today Cholamandalam Investment and Finance Co. Ltd. has the market capitalization of 1.41 T, it has increased by 5.41% over the last week.
Yes, you can track Cholamandalam Investment and Finance Co. Ltd. financials in yearly and quarterly reports right on TradingView.
Cholamandalam Investment and Finance Co. Ltd. is going to release the next earnings report on Jan 22, 2026. Keep track of upcoming events with our Earnings Calendar.
CHOLAFIN earnings for the last quarter are 13.70 INR per share, whereas the estimation was 14.16 INR resulting in a −3.28% surprise. The estimated earnings for the next quarter are 15.32 INR per share. See more details about Cholamandalam Investment and Finance Co. Ltd. earnings.
Cholamandalam Investment and Finance Co. Ltd. revenue for the last quarter amounts to 40.75 B INR, despite the estimated figure of 40.61 B INR. In the next quarter, revenue is expected to reach 43.75 B INR.
CHOLAFIN net income for the last quarter is 11.60 B INR, while the quarter before that showed 11.38 B INR of net income which accounts for 1.91% change. Track more Cholamandalam Investment and Finance Co. Ltd. financial stats to get the full picture.
Cholamandalam Investment and Finance Co. Ltd. dividend yield was 0.13% in 2024, and payout ratio reached 3.94%. The year before the numbers were 0.17% and 4.86% correspondingly. See high-dividend stocks and find more opportunities for your portfolio.
As of Dec 5, 2025, the company has 64.9 K employees. See our rating of the largest employees — is Cholamandalam Investment and Finance Co. Ltd. on this list?
EBITDA measures a company's operating performance, its growth signifies an improvement in the efficiency of a company. Cholamandalam Investment and Finance Co. Ltd. EBITDA is 95.89 B INR, and current EBITDA margin is 81.42%. See more stats in Cholamandalam Investment and Finance Co. Ltd. financial statements.
Like other stocks, CHOLAFIN shares are traded on stock exchanges, e.g. Nasdaq, Nyse, Euronext, and the easiest way to buy them is through an online stock broker. To do this, you need to open an account and follow a broker's procedures, then start trading. You can trade Cholamandalam Investment and Finance Co. Ltd. stock right from TradingView charts — choose your broker and connect to your account.
Investing in stocks requires a comprehensive research: you should carefully study all the available data, e.g. company's financials, related news, and its technical analysis. So Cholamandalam Investment and Finance Co. Ltd. technincal analysis shows the neutral today, and its 1 week rating is buy. Since market conditions are prone to changes, it's worth looking a bit further into the future — according to the 1 month rating Cholamandalam Investment and Finance Co. Ltd. stock shows the buy signal. See more of Cholamandalam Investment and Finance Co. Ltd. technicals for a more comprehensive analysis.
If you're still not sure, try looking for inspiration in our curated watchlists.
If you're still not sure, try looking for inspiration in our curated watchlists.