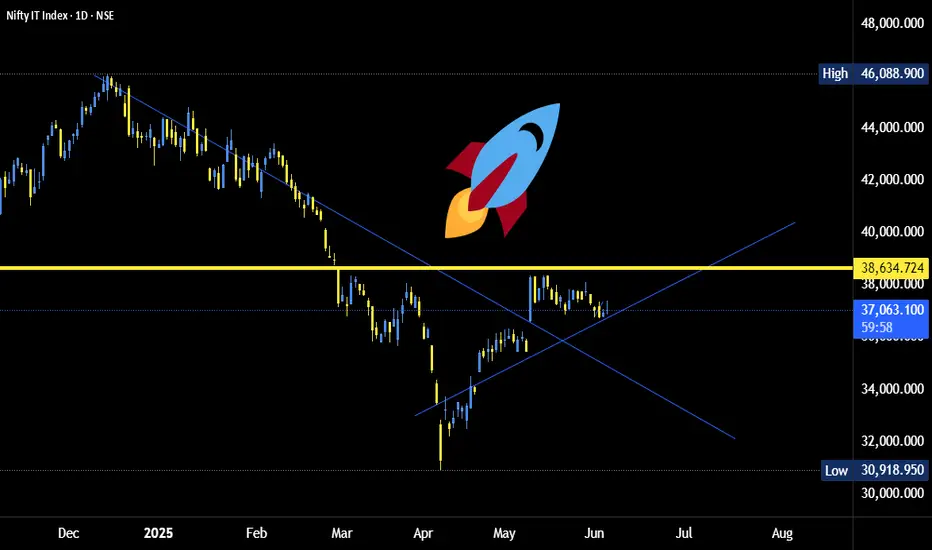
Bear Market Continuation This visual pattern suggest the Market in IT Sector will continue to Go down
I have Just put what i consider as patterns likely to unfold
This is education Content
Good luck
Trade ideas

NiftyITNifty IT | CMP: 33,702
The index made its all-time high (ATH) in December 2024 and has since been in a structural decline. After hitting a low in April 2025, it has been moving within a parallel channel, testing the upper boundary in June 2025.
Support Zone 1 (31,230–30,575):
This level has repeatedly acted as both supply and demand. It provided resistance in Nov 2022 and Feb 2023, later turning into strong support in Oct 2023, June 2024, and Apr 2025 . A retest of this zone cannot be ruled out, but if it fails to hold, the price may drift lower towards the next critical zone.
Support Zone 2 (26,399–25,499):
This is the most significant demand area, created largely during the consolidation phase between Jan–May 2021, and reinforced in Jun/Jul 2022, Sept 2022, and Apr 2023 . Post this accumulation, the index witnessed a sharp rally to its last ATH.
These two zones together formed a broad rectangular base between Jun 2021 – Aug 2023 , which provided strong momentum to the bulls.
The period from Mar 2020 – Jan 2022 was exceptional for the bulls, driving prices far ahead of valuations. While this resulted in the ATH, the subsequent correction was inevitable as disparity levels stretched excessively. The ongoing correction is essentially a healthy cooling-off phase before the next sustainable move.
That said, this entire consolidation and corrective cycle may still take another 1–2 years to fully play out.

IT Rockets INCOMING IT Sector is set to propel again looks like. Weekly RSI at exhaustion similar to MAy'24 levels. DXY expected to rise with USDINR going above 90+ and perhaps till 95 too. Foreign gains in USDINR to aid IT stock margins. Existing Offshore employees don't need VISA H1-B 1 lakh USD fees, so that's protected. PE Rerating will also aid the returns. Ratio chart is at support. BRACE.

its an opportunity to buyNifty IT Technical Analysis (CMP: 35590)
Elliott Wave Analysis: the box from the mid point completes the 5 waves. Hence the rally was wave 1 and this correction wave 2. Therefore any dip now is an opportunity to buy.
Fibonacci Analysis: The index's halt at the 61.8% retracement level suggests the uptrend remains intact.
Conclusion: While the initial rally may have been missed, the current dip offers a favorable buying opportunity, supported by multiple indicators.

Nifty IT daily strong short-term bullish IT daily chart is showing a strong short-term bullish setup, supported by a potential inverse head-and-shoulders pattern with key support near 34,200. The index is trading around 36,100 and aiming for the crucial 38,000 neckline. Positive sentiment is further boosted by the ongoing share buybacks of heavyweight constituents TCS and Infosys, which are likely to attract fresh buying interest. A decisive breakout above 38,000 could open the door for a continued up-move.

Nifty ITIT index has staged a sharp U-turn from the 34,000 support zone, helped by the buy-back announcements of heavyweights TCS and Infosys that lifted overall sector sentiment. This rebound aligns with the inverted head-and-shoulders pattern visible on the weekly chart, with 38,000 acting as the key neckline resistance.

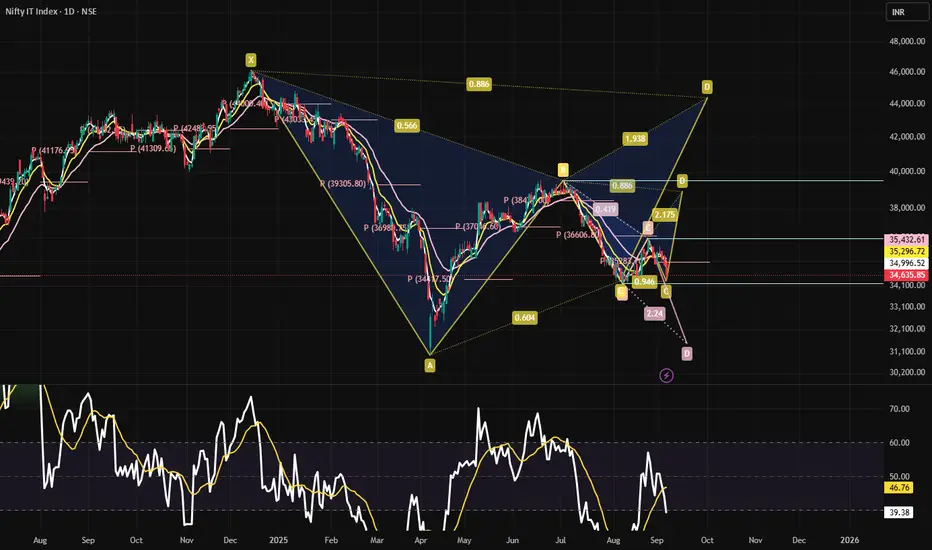
Nifty IT Index – Daily Chart UpdateA potential harmonic pattern (XABCD) is forming with bearish continuation signals.
📊 Key Levels
Resistance: 35,300 – 35,450
Support: 34,100, next at 31,000 (2.24 extension)
Current Price: 34,635 (-1.44%)
📈 Indicators
RSI at 39.38 → bearish momentum
Moving averages trending down
📌 View
Below 34,100 → likely slide toward 32,000 – 31,000
Above 35,400 → relief rally possible toward 37,000 – 38,400
CNXIT - Head & Shoulder in progress on weekly chartsThe Indian IT sector is in a terrible state. The formation of a head and shoulder pattern on a weekly chart is a disastrous indication of worse times ahead. While NSE:TCS fired 15k employees in the recent past, the future seems dimmer. A similar pattern can be observed in almost all IT stocks. Caution is the way forward. All the long positions in IT must be doubly checked and closely monitored.
Disclaimer: The idea is for educational and informational purposes only and must not be construed as advice to buy/sell. Please consult your investment advisor before making a financial decision. Investments are subject to market risks!
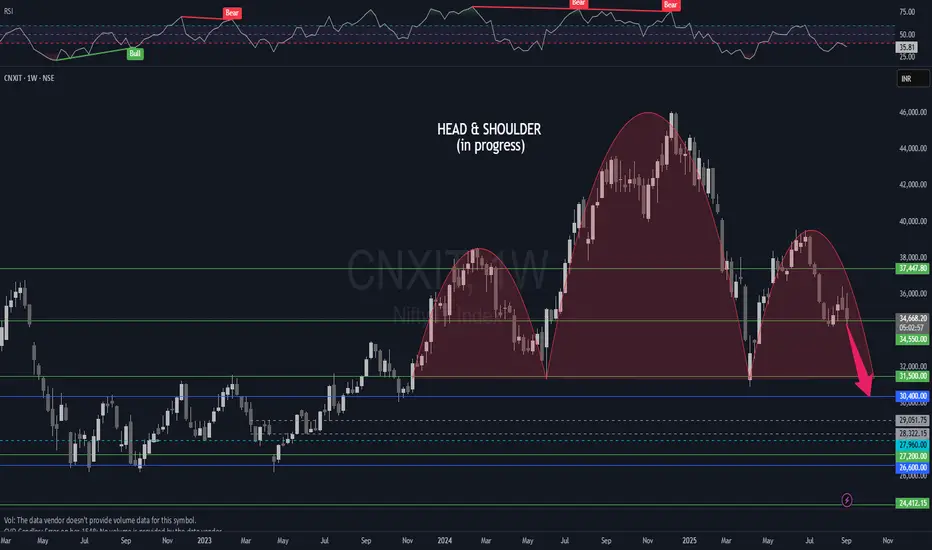
Beware of IT stocksBeware of IT stocks, it is forming head and shoulder pattern on weekly chart. Any opportunity till resistance area can be used as profit booking.

IT SectorHello & welcome to this analysis
The relative strength of CNX IT with Nifty is indicating the likelihood of a stronger reversal.
In the monthly time frame we can see after doing a 2x Fibonacci trend extension it did a retracement up to the I H S neckline.
In the weekly time frame we can see an early stages of the probability of a double bottom formation.
Current ratio is 1.45, if it can hold on a weekly basis above 1.39 it could continue to improve with resistance coming in at 1.55. A weekly close above 1.60 opens the probability of 1.90 and 2.10. Failure to hold 1.39 would suggest further downtrend continuation.
Relative Strength is a measure of 2 tradeable assets versus each other. In this case the analysis is if Nifty rallies then IT index will rally strong and if Nifty declines IT index will decline less as long the ratios mentioned above are maintained.
All the best

Nifty IT Index 1WLooks like forming Head & shoulder pattern in weekly chart and confirmation is below 32000 based upon weekly closing and it reflects on some IT stocks also

CNX-IT Chart describes the NIFTY IT weekly timeframe.
Well as of now there's no need to jump or rush & initiate a long investment holding in Nifty-IT.
The best opportunity to buy is near 28500-30000. As it will definitely going to hold the long trend line which is a green marking trend line, also 28500 is 50% Fibonacci Level, from swing low of March'20 & swing high of Dec'24, until then no need of getting long here.

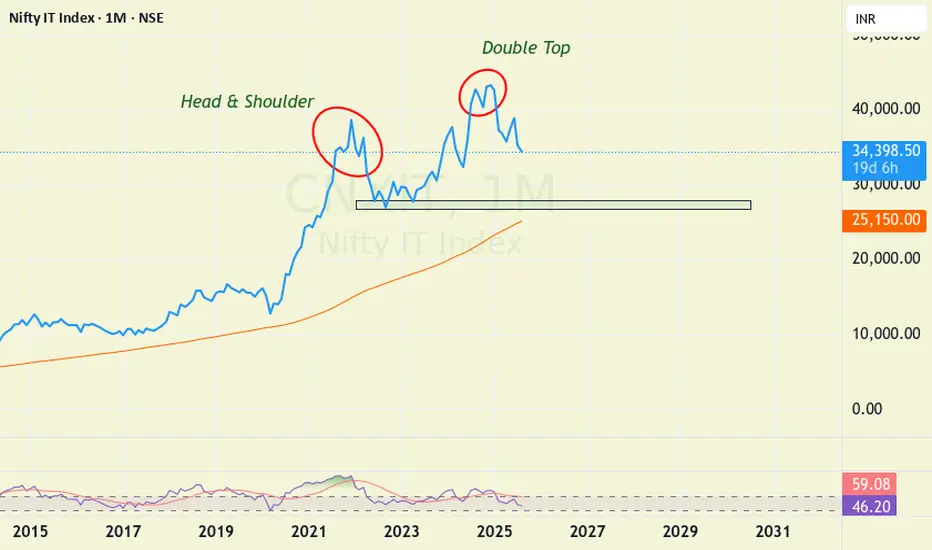
Bearish patterns in Nifty ITOn monthly we see multiple bearish patterns in IT index.
Over long term we can see that this index takes support near 100 SMA on monthly.
Currently this index is in down trend and in worst case can see support nr 29000 levels. Which also coincides with earlier buying zone.
I would avoid IT till I find some good bottoming out pattern.

Nifty IT Index Here’s a detailed snapshot of the **Nifty IT Sector**:
---
### 📊 Current Status & Performance
* The Nifty IT index closed at **37,031.75** on July 21, 2025, down **110.10 points (-0.30%)** from the previous close of 37,141.85 ( , ).
* Key metrics:
* **P/E ratio**: \~25.2
* **P/B ratio**: \~7.7
* **Dividend yield**: between 2.3% and 3.1% ( , ).
---
### 🔄 Returns Overview
| Period | Return |
| -------- | ------- |
| 1 Day | –0.3% |
| 1 Week | –0.65% |
| 1 Month | –5.0% |
| 3 Months | +8.5% |
| 6 Months | –11.2% |
| 1 Year | –7.2% |
| 3 Years | +30.7% |
| 5 Years | +114.4% |
( , )
---
### 📌 Index Composition
* Comprises **10 leading IT companies**:
Infosys (38.6%), TCS (22.3%), HCL Technologies, Tech Mahindra, Wipro, LTIMindtree, Coforge, Mphasis, Persistent Systems, Oracle Financial Services Software ( , , ).
* Weight is free‑float market‑cap based, revised semi‑annually ( , ).
---
### 📌 Sector & Market Context
* It tracks India’s top software services and consulting firms ( , ).
* Tools like ETFs and index funds allow investors to gain exposure — e.g., **Nippon India ETF Nifty IT**, **ICICI Prudential Nifty IT ETF**, **Kotak**, **Axis**, and **HDFC Nifty IT ETF**
---
### 🧭 Key Developments
* **Wipro** delivered a strong June quarter (Q1 FY26): net profit +11%, revenue +0.8%, top deal wins worth US\$5 billion, and share price rose \~4% ( ).
* Overall IT sector underperforms year-to-date, with overall Nifty IT down \~7% YTD, but has recovered \~8.5% over the past three months ( , ).
---
### ✅ Why It Matters
* Represents a key growth engine of the Indian economy and is a significant sub-index—about 13–14% of Nifty 50 ( ).
* It's a barometer for global demand in software services, digital transformation trends, and large enterprise contract cycles.
---
### 🎯 Investment Viewpoints
* **Near-term pressure** from global macro, interest-rate environment, and recent downward revisions.
* **Medium-term optimism** driven by strong earnings (e.g., Wipro), undemanding valuations, and sector recovery (\~+8.5% over 3 months).
* **Long-term momentum** is solid, with +30% over 3 years and +114% over 5 years, courtesy of recurring digital demand.
---
If you're considering investing in this space, explore Nifty IT ETFs or mutual funds—and diversify across the top 10 stocks rather than concentrating on one. Let me know if you’d like help comparing specific ETFs, tracking tools, or future performance scenarios!

Nifty IT Sector Quick ReviewHere’s a detailed list of the **major components of the NIFTY IT Index**, which represents India’s top-performing **information technology (IT)** companies listed on the NSE:
---
## 💻 **NIFTY IT Index – Overview**
* **Launched by:** NSE (National Stock Exchange)
* **Objective:** Track the performance of the **top IT companies** listed on NSE
* **Number of Constituents:** 10 stocks
* **Weighting Method:** Free-float market capitalization-weighted
* **Rebalancing:** Semi-annually
---
## 🔟 **Major Components of the NIFTY IT Index (as of 2025)**
| Rank | Company Name | Weight (Approx.) | Segment |
| ---- | ----------------------------------- | ---------------- | -------------------------------------- |
| 1 | **Tata Consultancy Services (TCS)** | \~30% | IT Services |
| 2 | **Infosys Ltd** | \~27% | IT Services |
| 3 | **HCL Technologies Ltd** | \~13% | IT Services |
| 4 | **Wipro Ltd** | \~9% | IT Services |
| 5 | **LTIMindtree Ltd** | \~7% | IT Consulting & Services |
| 6 | **Tech Mahindra Ltd** | \~6% | Telecom & IT |
| 7 | **Persistent Systems Ltd** | \~2.5% | Digital Engineering |
| 8 | **Coforge Ltd** | \~2% | IT Services (BFSI, Travel, Healthcare) |
| 9 | **Mphasis Ltd** | \~2% | IT & BPO Services |
| 10 | **Birlasoft Ltd** | \~1% | ERP, Cloud, IT Services |
> 🧠 *Note:* The exact weights change frequently based on market cap fluctuations and NSE index reviews.
---
## 📌 Key Insights
* The **top 3 companies (TCS, Infosys, HCL Tech)** make up **70%+** of the index.
* All companies primarily focus on **IT services**, **software development**, **cloud**, **AI/ML**, **cybersecurity**, and **digital transformation**.
* This index is often considered a **barometer of India’s tech outsourcing** industry.
---
## 📊 Sector Representation
* **BFSI Tech Services**: Infosys, Mphasis, Coforge
* **Digital/Cloud/AI**: Persistent, Birlasoft
* **Telecom & Engineering IT**: Tech Mahindra, LTIMindtree
* **Legacy & Enterprise IT**: TCS, HCL, Wipro
---
## 🧮 NIFTY IT vs NIFTY 50
| Feature | NIFTY IT | NIFTY 50 |
| -------------------- | --------------------- | ------------------- |
| Sector Focus | Purely IT companies | Diversified sectors |
| Volatility | Higher (tech-led) | Lower |
| Global Exposure | High (exports-driven) | Mixed |
| Currency Sensitivity | Very High (USD/INR) | Moderate |
---
thanks

SECTOR WATCH NIFTY ITBig Breakout on the watch
Inverse head and shoulder pattern on NIFTY IT chart.
Pattern is already activated and can accumulate IT stocks.
CMP 38600 TARGET OF 45000 with SL of right shoulder 36700
#harmonic
#sector analysis
#headandshoulder
#breakout
#trading

IT Index - On verge of Bull ride commencementIT Index h as formed Inverted Head and Shoulder and ADX>25.
supertrend (34,3) shows Buy.
Price above 200 DMA.
As soon as golden cross over occurs and bullish candle appears above the neck line the Bull Run starts.
Targets as per Fibonacci Retracement are marked
Brace up.
Idea for academic interest and not a recommendation to buy

NIFTY ITNifty IT is on the verge of inverted Head & Shoulder pattern breakout. This is reversal pattern and traders should avoid shorting IT companies. From here I would prefer to go with long side position in IT stocks like TCS, INFY, HCLTECH, WIPRO, CYIENT, KPITTECH, PERSISTENT, TECHM.
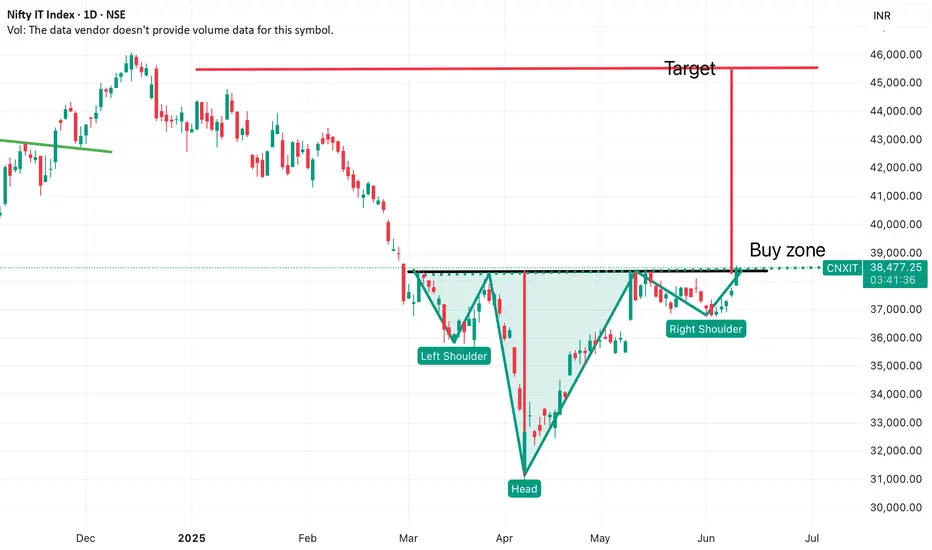
CNXITThe CNX IT index is currently forming an inverse Head & Shoulders pattern, a bullish reversal formation. The index made a bottom at 30918 on 7th April 2024, which aligns with a prior support zone tested on 4th June 2024, followed by a strong upward move. This double test of support indicates a solid base formation.
If the pattern plays out, a breakout above the neckline could open the way toward the supply zone of 41600–43430, where previous selling pressure was observed.

Nifty Bank Nifty & IT Index In the technical analysis of this video we are understanding where Nifty is preparing to go in the next 52 weeks, as well as where Bank Nifty will be weak and where it will be strong, as well as what are the possibilities of Nifty in the IT sector in the next 52 weeks

Nifty IT Index ProjectionWe will soon see a bull run in Nifty IT sector crossing the 200 day moving average price. Yellow line represents the 200 day moving average price.
All time high NiftyIT has crossed life time high after 3 years of consolidation and it is poised for higher and more higher.
