Textbook Price Action - Nifty iT
Hey fellow traders and chart enthusiasts, Here’s a fresh breakdown of the Nifty IT Index, which is currently at a make or break zone after a significant correction of almost 30%.
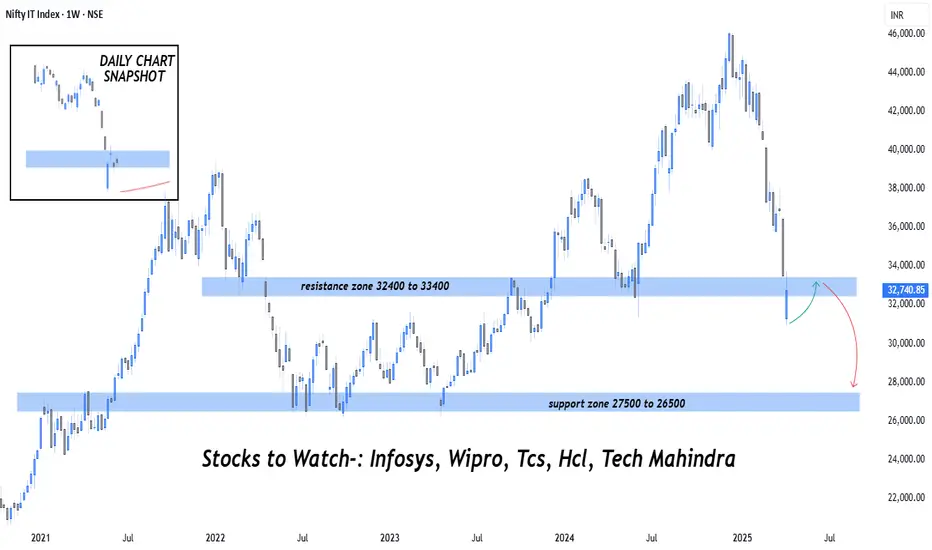
So we can see the index recently broke a strong demand zone 33400 to 32400 which I marked now as a resistance and this breakdown came with strong bearish momentum which shouldn't be ignored and after we are seeing a classic example where price is testing a resistance zone which earlier was a support zone.
Let's zoom what daily chart say ? So please check the inserted snapshot in inset where we are seeing a tight consolidation just below the resistance zone where price is hesitating and a small bullish bounce is underway but there is no follow through so far.
Levels to watch-:
Resistance zone- 32400 To 33400.
Support zone- 27500 to 26500.
Invalidation for Bears- Weekly and daily close above 33400.
So basically i prepare two trading scenes sharing below.
Bearish Continuation-:
Failure to reclaim resistance after this or next rejection will likely lead to another leg down, possibly testing the next support area near 27500 to 26500.
Bullish reclaim-:
If buyers push the price back above 33400 with bullish strength and conviction, we may see a relief rally toward 36000 and beyond and that would invalidate the current bearish structure for some time.
This Publication is meant for only learning purpose.
Hope you like the idea, thanks in advance for your coming support.
Trade ideas
#NIFTY IT Technical Analysis (Weekly Timeframe)🧠 Technical Analysis (Weekly Timeframe):
📌 Key Levels Marked:
Major Support (Black Line): ~₹30,951
Historical Support Zone (Blue Line): ~₹27,148
🔍 Price Action Insight:
Recent Pullback from Support (~₹31,000):
Price respected a historical support zone and gave a bullish reversal candle.
This zone has acted as support multiple times (2021, 2022, and now 2025).
Strong bounce suggests buyers defending the zone.
Structure:
The index recently saw a sharp correction from its peak near ₹48,000.
Now forming a possible bottoming structure near ₹31,000.
Current Price: ₹33,372.35
Up by +1.93% this week, signaling potential shift in sentiment.
Still below the previous support-turned-resistance zone around ₹36,000.
📊 Volume Observation:
Volume data not shown (marked with “!”), but price reaction at support is technically significant regardless.
📈 What to Watch Next:
✅ Bullish Scenario:
Sustaining above ₹33,000 could trigger a move to ₹35,500–₹36,000 zone.
Break above ₹36,000 could open doors for trend continuation.
❌ Bearish Scenario:
If it slips below ₹31,000 again, next major support is around ₹27,150.
That would complete a larger correction from the 2024 highs.
📌 Important Notes:
Nifty IT tends to follow cues from global tech (especially Nasdaq).
Keep an eye on macro cues, rupee movement, and Q4 earnings.
🧾 Disclosure:
This is a technical view only based on price structure and historical price action.
This is not investment advice or a recommendation. Please consult your SEBI-registered investment advisor before making trading or investing decisions.
I do not hold any position in the Nifty IT Index at the time of this analysis.

cnx it cnx it
The index recently showed mixed signals with some technical indicators suggesting a "Strong sell" while others leaned towards "Sell SELL.

Nifty IT, bearish signalsBearish Divergence Alert on #NIFTYIT
A classic warning sign! Price made a higher high, but RSI made a lower high
RSI nearing 50, a breakdown confirms further fall.
Be alert for IT stocks.

Leaders and LaggardsNifty IT CMP 35986
Since there are leaders and laggards amongst the various sectors. Here is the IT index which is lagging behind the others. Since the rest have taken off , here lies an opportunity to enter the correction right at the bottom. In my view the Index should bottom in a week or two.

NIFTY IT INDEX :: BIG ALERT Date : 13.02.2025
Nifty IT Index
Timeframe : Day Chart
Remarks :
1 Nifty IT Index is exiting the Diamond pattern towards downside, as a breakdown
2 Diamond patterns on the top of the trends or bottom of the trends are very critical
3 41700 is the level traders & investors should be watchful of on closing basis, daily/weekly
4 Closing below 41700 is cautious signal & try to soften positions in IT Sectors
5 The breakout level is 42950 & the gap between two levels is of 3%
6 That 3% gap between the two key levels is no trade zone
7 Future kumo is also expanding & forming flat kumo as strong resistance
8 At least wait for Nifty IT to resume Diamond pattern & then will see reversal happening or not
Regards,
Ankur

How to use technical analysis in trading ?How to perform technical analysis
Identifying the trend. This is the first step in technical analysis for traders because trading strategies can either follow the trend or go against the trend. ...
Drawing support and resistance levels. ...
Establishing entry and exit points. ...
Position sizing and risk management.
Technical analysis seeks to predict price movements by examining historical data, mainly price and volume. It helps traders and investors navigate the gap between intrinsic value and market price by leveraging techniques like statistical analysis and behavioral economics

Option chain pcr and its relevanceThe Put-Call Ratio (PCR) is a popular technical indicator used by investors to assess market sentiment. It is calculated by dividing the volume or open interest of put options by call options over a specific time period. A higher PCR suggests bearish sentiment, while a lower PCR indicates bullish sentiment.
The Put-Call Ratio (PCR) is a useful indicator to understand the market sentiment at any given time. A high PCR suggests a bearish market, while a low PCR signals bullish tendencies. It helps investors assess whether the market is leaning towards optimism or pessimism, which can shape investment strategies.

cnxit very weak target 1 is 95% sure and probablitiy is high
target 2 is60% . delayed or it may take time if it resist some time near target 1

Nifty IT index Under Pressur ? Information technology (IT) sector challenges and possibilities in india
The Nifty IT Index tracks the top IT companies listed on the NSE. It shows the performance and trends of India's IT sector, which plays a key role in the country's GDP
Infosys Ltd HCL Technologies Ltd Wipro Ltd , LTIMindtree Ltd ,Tech Mahindra Ltd , Persistent Systems Ltd , Coforge Ltd , Mphasis Ltd , L&T Technology Services Ltd are major stock in IT index .
Challenges:
Global economic uncertainties
Inflation and spending cuts
Rapidly changing trends in digital technologies
Possibilities:
Growing demand for digital transformation.
Emerging opportunities in Artificial Intelligence (AI), cloud computing, and data analytics.
Increasing IT exports from India.
The weakness of the dollar poses a challenge for the Indian IT sector:
Revenue Impact: A weaker dollar reduces the value of dollar earnings in INR, lowering revenue and profits.
Pricing Pressure: US clients may push IT companies to reduce prices or renegotiate contracts.
Higher Costs: Inflation and currency changes can increase operational costs like salaries and services.
Client Spending: US clients’ reduced purchasing power can impact demand for IT services.
Cheaper Imports: Dollar weakness makes foreign tech and equipment purchases cheaper for Indian firms.
Competitive Edge : Indian IT services may become pricier compared to global competitors.
Export Dependency: Heavy reliance on the US market heightens vulnerability to currency fluctuations.
Growth Concerns: Combined effects can slow revenue growth and sector performance.
During COVID (2020-2021) and after, the IT sector saw a significant boom.
The demand for digitalization surged rapidly.
Technologies like cloud services, cybersecurity, and work-from-home tools became essential.
IT companies benefited greatly from this unexpected demand.
Compared to other sectors, IT had higher growth and demand.
As a result, the IT sector performed better than most industries.
The Nifty IT Index delivered record-breaking performance.
Now, there is a possibility of profit booking in IT stocks.
This is due to the high valuations after the sector’s massive growth.

Nifty IT Index Analysis!Nifty IT Index Break Long And Short Term Moving Averages And Possible Downtrending Channel Breakdown Below - 41,900. Avoid Long Positions.

Nifty IT - Perfect Head and ShoulderNifty IT is super weak, should fall in the coming days, if support is broken.

Market overviewAs we see overall Indian market is being negative.
1) The structure of nifty 500 is not good.
2) Nifty 50 is already broke inverted head and shoulder pattern.
3) Banknifty structure is little better but having low high structure.
4) Mid cap better than nifty 50.
5) NityIT is showing strength. it has already breakout its all time high and retracing back on 50EMA.RS is also positive.
6) Niftypharma is also breakingout from 50EMA RS is positive. mid cap better than nifty 50
7) Smallcap is showing strength. It has moved above its all time high and retracting back on 50EMA.

IT SECTOR OVERVIEW: Super Bullish!Observation & Overview:
1. The IT Index was beaten down in late 2022.
2. After 2023 it formed a bottom and prices started gaining strength.
3. 2024 price started forming Higher Highs & Higher Lows, touched the previous 2022 ATH and currently, taking support from the 50% of the swing and also bouncing from a D tf demand.
4. It is acting as a major support zone and good weekly candle rejection can be noticed.
5. Signs of buyers getting dominant and it should break the ATH soon.
6. I'm expecting a minimum 15% ROI from this sector turnaround.
7. Hopefully, with sector rotation this sector is going to gain momentum eventually.
- Stay tuned for further insights, updates and trade safely!
- If you liked the analysis, don't forget to leave a comment and boost the post. Happy trading!
Disclaimer: This is NOT a buy/sell recommendation. This post is meant for learning purposes only. Please, do your due diligence before investing.
Thanks & Regards,
Anubrata Ray


CNXIT IndexHello & welcome to this analysis
The index is in the PRZ of a bearish Harmonic Butterfly pattern in the daily time frame.
It will get activated if the index starts moving below 44300 for a pullback to the slanting trend line shown in the chart

NIFTY IT Breakout retestHello Everyone,
Nifty It view if takin 200ema support then upmove possible as cup and handle breakout retest is happening

The Outperformer's Guide: Top Stocks from Each SectorThis analysis highlights key sectors and stocks to watch.
1. Nifty IT NSE:CNXIT
● The Nifty IT sector has demonstrated resilience during the recent negative market sentiments.
● Notably, it has formed a Descending Broadening Wedge pattern and expected to breakout soon.
➖ Stock to Watch - Coforge NSE:COFORGE
● The stock is currently trading just below its all-time high with a strong uptrend.
● Investors can consider accumulating shares on any dips.
2. Nifty Finance NSE:CNXFINANCE
● The Nifty Finance sector has recently breached its trendline support and is now approaching its next key support level, ranging from 22,500 to 22,700.
➖ Stock to Watch - Axis Bank NSE:AXISBANK
● The stock is currently trading at its support level, offering a potential short to mid-term trading opportunity.
3. Nifty PSU Bank NSE:CNXPSUBANK
● The Nifty PSU Bank sector has consolidated within a range and is nearing its support zone.
➖ Stocks to Watch - State Bank of India NSE:SBIN
● The stock is approaching its trendline support level.
● A buying opportunity may arise if the price reaches the 770 level.
4. Nifty Pharma NSE:CNXPHARMA
● After experiencing a downturn, the Nifty Pharma sector is now approaching its trendline support level.
➖ Stocks to Watch - Divis Laboratories NSE:DIVISLAB
● The price is overall in an uptrend.
● Following a record peak, the stock is now nearing its trendline support level.
● The best buy zone is between 5,500 and 5,600.
5. Nifty Media NSE:CNXMEDIA
● The Nifty Media sector is expected to witness a potential pullback towards the 1,720-1,760 level.
➖ Stocks to Watch - Network18 Media NSE:NETWORK18
● The stock is trading just above its trendline support zone, presenting a short to mid-term trading opportunity.
6. Nifty Realty NSE:CNXREALTY
● The Nifty Realty index is currently trading above its support zone.
➖ Stocks to Watch - Oberoi Realty NSE:OBEROIRLTY
● The stock is trading at the support zone and expected to rise soon.
7. Nifty FMCG NSE:CNXFMCG
● After a downfall, index is approaching its trendline support level
➖ Stocks to Watch - Varun Beverages NSE:VBL
● VBL is trading above its support zone, offering a short to mid-term trading opportunity.
8. Nifty Metal NSE:CNXMETAL
● The Nifty Metal sector is trading above its support zone,
➖ Stocks to Watch - Ratnamani Metals & Tubes NSE:RATNAMANI
● The stock price has formed an Ascending Triangle pattern and is currently trading above the support level.
9. Nifty Oil & Gas NSE:NIFTY_OIL_AND_GAS
● The Nifty Oil & Gas sector is also trading above its support zone.
➖ Stocks to Watch - Aegis Logistics NSE:AEGISLOG
● The stock price is close to breaking through its trendline resistance.
● If it can maintain its position above this level, a rally may be imminent.
10. Nifty Auto NSE:CNXAUTO
● Lastly, the Nifty Auto sector is trading above its support zone.
➖ Stocks to Watch - Eicher Motors NSE:EICHERMOT
● Eicher Motors is consolidating within a rectangle pattern, indicating a potential breakout.

NIFTY IT Break Down Before US ElectionNifty IT is currently break down and negative trend in before the us election. In the current market correction this is the one of the most positive and attractive sector in the indian market but this week the price is fall Nifty IT Company in the FII Friendly but Huge selling in the FII Less impact in the market.
Now currently my point of the view after the US Election ( If Donald Trump Win ) One time this is show in the deep correction, but we are bullish because this is the more beneficial of the Interest rate cut

SMT between NIFTY and IT?Have been back-testing indulging in ICT/SMC concepts and have been noticing bearish SMTs/divergences being formed between BANK, IT and NIFTY (higher highs and lower lows) every time NIFTY proceeds to correct heavily.
Seeing how IT dumped relative to NIFTY's run today, I was hoping to find something like this.
Could be context to an incoming correction.
-GSS

NiftyIT - CNXIT - Weekly -Cup and HandleNifty IT Weekly analysis of the Nifty IT Index, showing a Cup and Handle pattern
Key Insights:
Cup and Handle Pattern:
The pattern began forming around mid-2022 and completed by 2023.
The breakout from the handle occurred around 38,539.00, which is a critical support level now.
Measured Move and Target:
The chart projects a potential upside target near 51,077.75, based on the height of the cup.
A 48.01% gain from the lowest point of the cup is also marked, giving more context to the potential upside.
The measurement from the cup's bottom to the breakout level shows a 32.48% gain potential from the breakout point.
Price Action:
The index reached a recent high of 43,645.90 before pulling back slightly to 42,089.30.
The pullback might be a healthy consolidation after the strong upward move.
Support Levels:
Key support is identified at 38,539.00, which was the breakout point of the handle.
The chart shows another strong support level at 26,164.20, which was the bottom of the cup, though this level seems far from the current price.
Conclusion:
The Nifty IT Index appears to be in a bullish continuation phase after breaking out of a multi-month cup and handle pattern. While the target of 51,000 seems plausible, a healthy pullback or consolidation might occur around the 42,000 to 38,500 levels before further upside.
The CNX IT (Nifty IT) index consists of the major IT companies
Here's a list of the top stocks that are generally part of the Nifty IT Index:
Tata Consultancy Services (TCS)
Infosys Ltd.
Wipro Ltd.
HCL Technologies Ltd.
Tech Mahindra Ltd.
L&T Technology Services Ltd.
Mphasis Ltd.
Coforge Ltd.
Persistent Systems Ltd.
LTIMindtree Ltd.

Nifty IT Index Date 18.09.2024
Nifty IT Index
Timeframe : Day Chart
Top constituents by weightage
1 Infosys = 28.45 %
2 Tata Consultancy Services = 24.57 %
3 HCL Technologies = 9.88 %
4 Tech Mahindra = 9.35 %
5 Wipro = 7.81 %
6 LTI-Mindtree = 5.81 %
7 Persistent Systems = 5.56 %
8 Coforge = 4.30 %
9 Mphasis = 2.65 %
10 L&T Technology Services = 1.61 %
NIFTY IT CURRENT PE = 34.4
NIFTY IT DIV = 1.9 %
NIFTY IT EPS = 1223
Remarks :
Forming right-angled ascending broadening wedge at fibonacci extension 1.61%.
If breaks the base of pattern then weak/bearish. Its kind of volatile pattern. Keep your position in Nifty IT stocks according to Nifty IT Index chart shared.
Regards,
Ankur

CNXIT // levels // 8h"Welcome to SkyTradingZone "
Hello Everyone 👋
Levels in CNXIT:
Level 1: Junior Executive (JE) - ₹300 - ₹500 per hour
Level 2: Executive (EX) - ₹500 - ₹800 per hour
Level 3: Senior Executive (SX) - ₹800 - ₹1,200 per hour
Level 4: Assistant Manager (AM) - ₹1,200 - ¥1,800 per hour
Level 5: Manager (M) - ¥1,800 - ¥2,500 per hour
Level 6: Senior Manager (SM) - ¥2,500 - ¥3,500 per hour
Level 7: General Manager (GM) - ¥3,500 - ¥4,800 per hour
Level 8: Executive Director (ED) - ¥4,800 - ¥6,400 per hour
