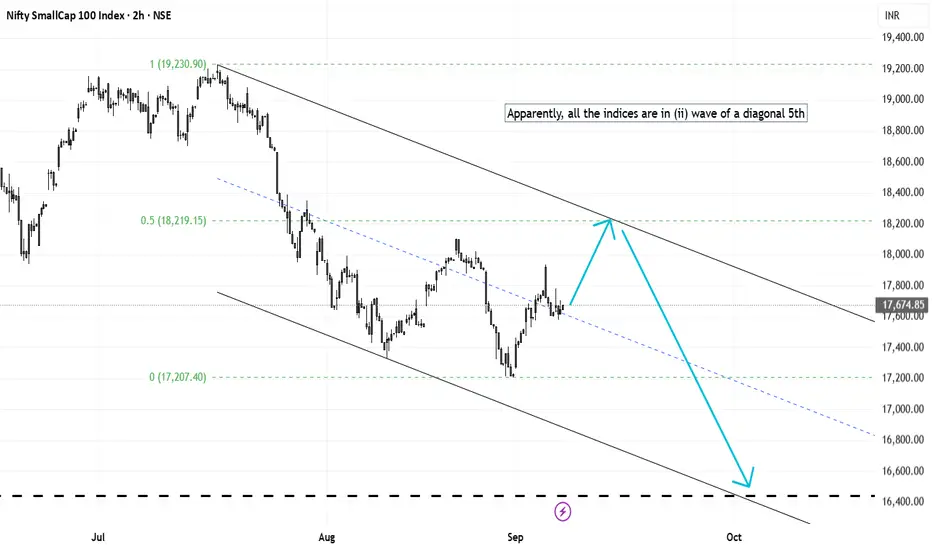
Elliott Wave Analysis of NIFTY Small Cap 100 CNXSMALLCAPThis is to be tracked on daily basis and the counts may change. But for now, for all the indices to be in (ii) wave retracement of a diagonal 5th is a good possibility.
CNXSMALLCAP trade ideas
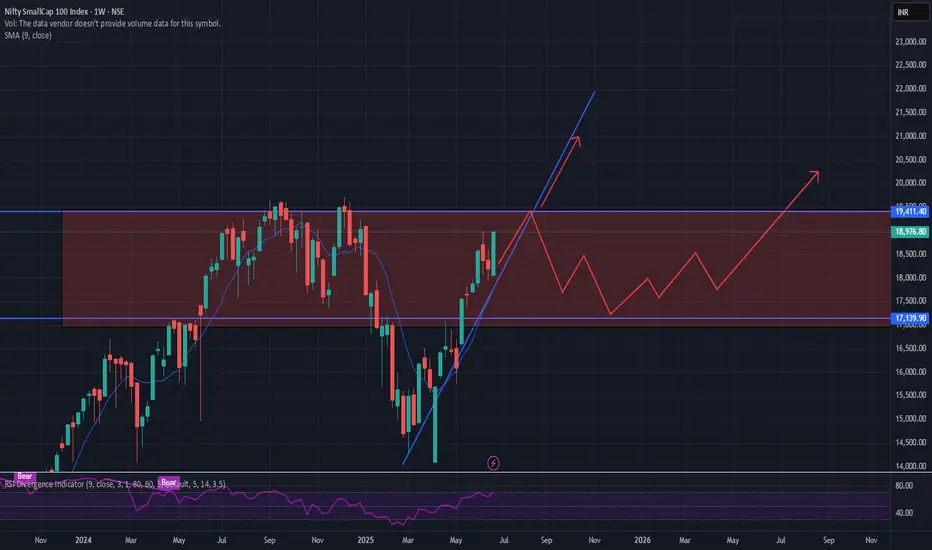
Bullish Consolidation and Anticipated BreakoutThe chart analysis indicates that the Nifty SmallCap 100 Index is currently in a consolidation phase within the red rectangular zone. The blue upward trend line and the arrow suggest a bullish sentiment, with potential for the stock to break out of the consolidation range and continue its upward trajectory
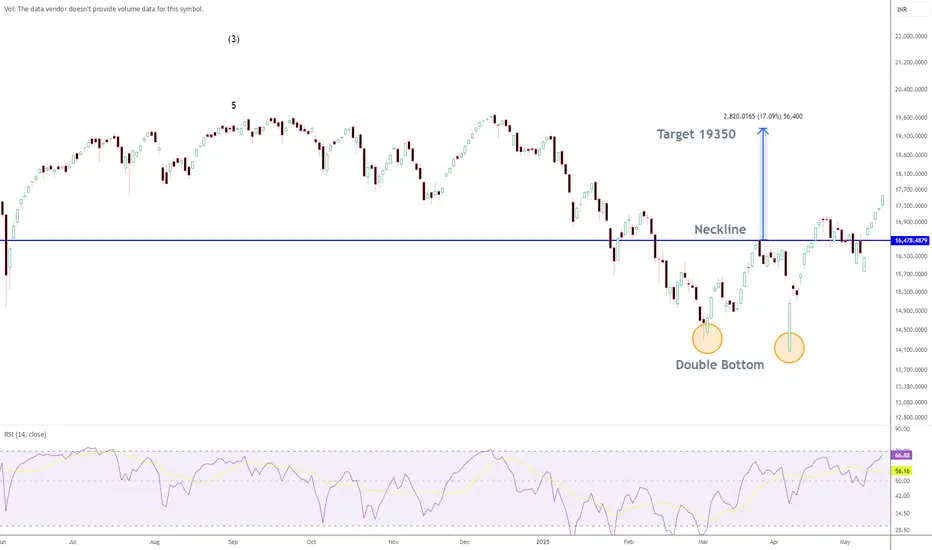
Nify Small Cap Index TargetA double bottom is seen in Nifty Small Cap Index and the Index has decisively broke above the neckline. The target for Index is close to 19350 based on double bottom projection
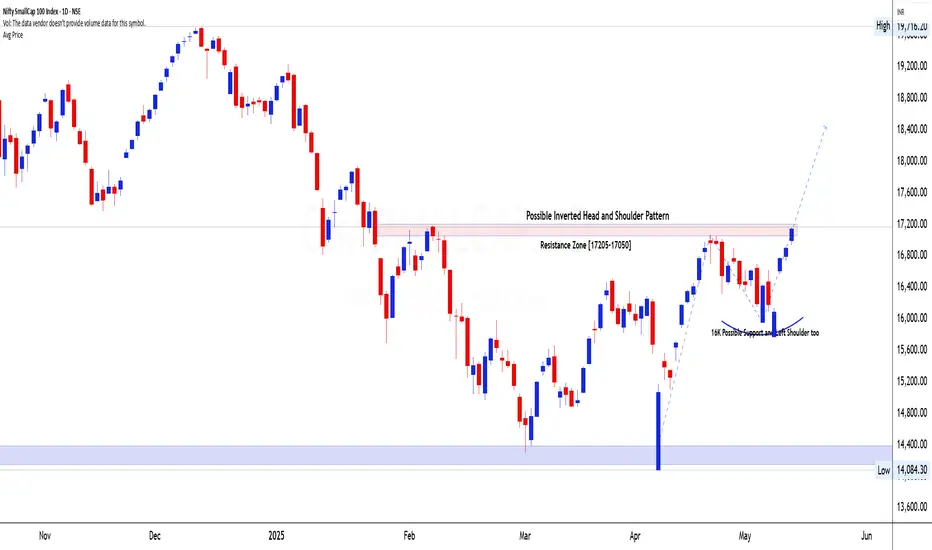
Nifty Smallcap- Inverted Head and Shoulder Pattern🚀 Breakout Watch Alert: Nifty SmallCap 100 Index (CNXSMALLCAP)
📌 Price: ₹17,147 📅 Date: 14-05-2025
① Pattern Name, Timeframe, Structure & Explanation
Pattern: Inverted Head & Shoulders
Timeframe: Daily Chart
Duration: \~4 Months (From Jan to May 2025)
The Nifty SmallCap 100 Index has formed a well-defined Inverted Head and Shoulders pattern, a bullish reversal structure commonly seen at the end of a downtrend. This pattern spans across four months with:
* Left Shoulder: Formed in early March after a sharp drop from 17,200
* Head: Deep retest toward the 16,000 zone in mid-April
* Right Shoulder: Shallow retest of the same 16,000 support in early May, confirming accumulation
The neckline of this pattern lies in the 17,050–17,200 resistance zone, which has already been tested twice before and now again in mid-May, creating a powerful breakout scenario.
② Volume Formation (During Pattern, Breakout, and Retest)
While exact volume data isn't available on this index chart, we can infer participation from the candlestick structure:
* During the pattern: The volume was likely lower during the head formation and began picking up as price formed the right shoulder.
* Last 4 Days: Strong bullish marubozu candles suggest heavy demand stepping in — indicative of institutional activity and rotation into smallcaps.
* Retest Volume: If a minor pullback occurs toward the neckline post-breakout, watch for lower volume to confirm a constructive retest.
③ Breakout Candlestick, Follow-Through & Trap Behavior
* Breakout Zone: ₹17,205–17,250
* The past four sessions include strong bullish marubozu candles — full-bodied with little to no upper wicks, implying decisive momentum.
* The clean structure avoids false moves — a tight V-shape bottom at the head followed by a right shoulder that mirrors the left. There's no bear trap, but a clear build-up without volatility spikes — ideal for positional traders.
④ Trade Explanation (Entry, Target, Stop-loss, Risk\:Reward)
* Entry Zone: ₹17,250+ (Breakout confirmation above neckline)
* Stop-loss: ₹16,500 (below right shoulder support & recent swing lows)
* Target Zone: ₹18,000 (1st target), ₹19,500 (extended target)
📏 *Measured Move Logic:*
Neckline = ₹17,200
Head = ₹16,000
Breakout Move ≈ ₹1,200
Projected target = ₹17,200 + ₹1,200 = ₹18,400 (Aligns with our zone)
Risk\:Reward:
Risk = ₹750
Reward = ₹1,250 to ₹2,000
R\:R = \~1:1.7 to 1:2.5
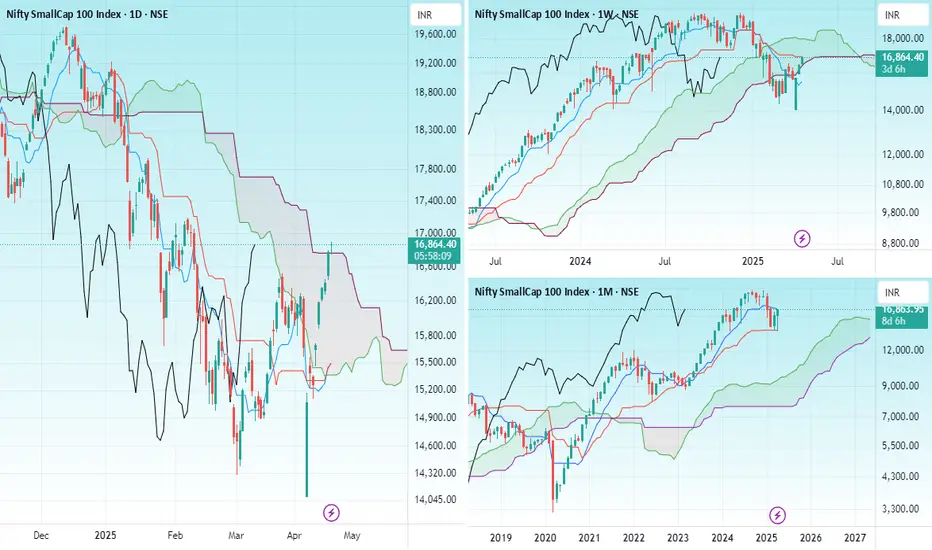
SMALL CAP INDEXHello & welcome to this analysis
The index gave a sharp bounce back like the rest of the market and is now near a cluster resistance - monthly, weekly & daily @ 16900.
It could consolidate in this zone before trying a breakout for 17500 else dip down to 16000 where it has good support.
Fresh buying in small caps at current levels for short term should be done with caution else wait for breakout above 16900 or dip down to 16000 approx.
nifty small cap ratio chart Green line is ratio chart of Small cap100 vs Nifty500 and blue line 30WEma
it is clearly evident that outperformance of Smallcap is in Stage4,begin from Jan25
Value migration might happen to larger names

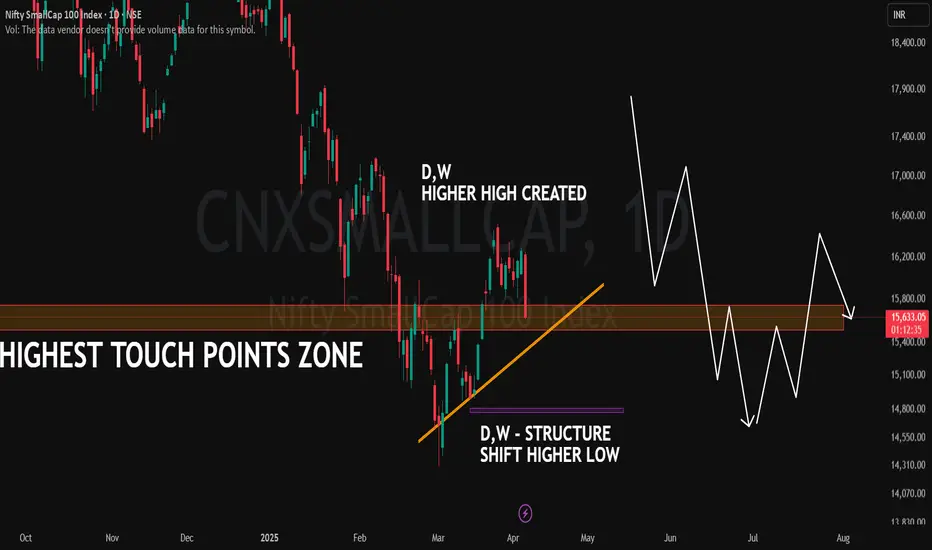
Nifty SmallCap 100 | Key Structural Zone 📊 Index: Nifty SmallCap 100 (NSE)
📉 CMP: 15,633 (-3.22%)
Chart Breakdown:
🔶 Highest Touch Points Zone: A key historical level where price has reacted multiple times.
📈 Higher High Created (D,W): Price has formed a higher high on both daily and weekly timeframes, indicating a shift in structure.
🟠 Trendline Support (Orange Line): A rising trendline acting as dynamic support.
🟣 Higher Low Structure (D,W): A significant shift where a higher low was established on daily and weekly charts.
The price is currently interacting with a crucial zone, making it a significant area to observe.
Smallcap 100: No trades yetNIFTY SMALLCAP
➡️My customised indicator telling me to wait. This is one of the tools I use to decide the market breadth.
➡️When the index is above the channel, the chances of getting trades right and extremely rewarding are higher.
➡️Below it, it’s not the most conducive trading environment especially in smallcap.
➡️Not jumping onto new positional trades as of now.

Small cap bottoming outAs can be seen nr 15000 level we see buying interest.
Now we can also see inverse head and shoulder formation.
Small caps are now in buy on dips zone.

A rally to exit ur small caps n mid capsNifty Small Cap 50 Vs Nifty 50
Ratio Study- I had posted this at the start of Jan. If u see history once the falls sets in it has never given u a second opportunity. It has made an exception this time around. In my view this rally is the last opportunity. The rally can go max to .618. So in my view we have this month and the next. Use this rally to exit ur midcaps and small caps.

we gotta reverse/pause from here or open doors for a much deep we gotta reverse/pause from here
or open doors for a much deeper 40% correction from ATH on Smallcap 100 index

Smallcap Index Breakdown: Retailers Brace for Impact!Smallcap Index Breakdown: Retailers Brace for Impact!
The Smallcap Index has fallen decisively out of its rectangle base. While it briefly re-entered the zone, it has now resumed its breakdown trajectory, signalling more pain ahead for portfolios.
🔎 What to Watch For:
Testing of the 14,900 support seems increasingly probable.
A 2-3% drop in Nifty could potentially double the impact on Midcap, Smallcap, and Microcap indices.
Retail investors, especially those who bought near the highs, are likely to feel the brunt of this breakdown.
⚠️ Why It Matters:
Breakdown in Smallcap and Microcap indices could trigger widespread panic selling.
Investors need to manage risks proactively and avoid emotional decisions.
The recent breakdown is a reminder to maintain disciplined investing and avoid impulsive decisions. Focus on long-term strategies that align with your goals and risk appetite.
💡 Actionable Insight:
Rather than reacting emotionally to the market, this is a good time to focus on capital protection strategies. Ensure you’re following proper risk management and avoid overexposure to high-risk assets.
💬 Let’s Discuss:
How do you plan to navigate this potential storm? Will the index find support at 14,900, or is more downside imminent?
🛑 Disclaimer: This analysis is for educational purposes only and is not financial advice. Please consult with your financial advisor for personalized guidance.

Doubletop in nifty smallcapA clear double top breakdown seen in smallcap index.
It will take 6 to 12 weeks for smallcap index to make bottom.
Likelt support levels on chart.

Nifty Smallcap - Divergence at PlayNifty small cap is at a very good support. This is also in line with a bullish divergence on the RSI which also suggest that a bullish temporary reversal is on the cards.

Nifty SmallCap 100 DOWNTREND TO RESUMEPrice has completed a Classic Trend Line Breakdown Retest today and so the Pullback Rally is done and now Impulsive Decline should resume
Attached: Daily Chart Live as of 21st Jan 2025

NIFTY SMALLCAP INDEX: Critical Zone - Decisive Moment!⚡️Price Analysis:
1️⃣ Price has reached a crucial demand zone.
2️⃣ Price rejected from marked Sz.
3️⃣ Recent price action shows increased volatility with strong bearish candles
4️⃣ Trading near EMA support - indicate a bounce on the upside possible.
5️⃣ Price structure is bearish in the Hourly tf.
✨ Key Observations:
➡️ Recent -2.61% drop shows aggressive selling.
➡️ Small caps showing relative weakness compared to large caps.
➡️ RRR best near 17,000 round level with tight stops
➡️ Risk Scenario: A break below 17,000 could trigger panic selling towards 16,000.
➡️ Expecting initial bounce attempts from the Dz & EMA
⚠️ Disclaimer: This is NOT a buy/sell recommendation. This post is meant for learning purposes only. Views are personal. Please, do your due diligence before investing.⚠️
💬 Are you tracking any specific smallcap stocks? Share in the comments below! ✌️
🔥 Happy Trading!✅🚀

SMALLCAP 100 INDEX : Either of the 2 scenarios possible!⚡Price Analysis:
1️⃣ Overall price structure is bullish.
2️⃣ Price is overing around critical support.
3️⃣ Index broke the last high to form a HH struture.
✨ My Personal Views:
➡️ Expecting it to move in HH-HL formations.
➡️ Important Fibonacci support will be respected.
➡️ Either of the 2 marked cases looks highly possible.
➡️MTF:
- Monthly candle is not looking good as of now, there is a rejection from the top. Monthly candle closing atleast above 19100 will indicate strength.
⚠️ Disclaimer: This is NOT a buy/sell recommendation. This post is meant for learning purposes only. Views are personal. Please, do your due diligence before investing.⚠️
💬 Drop your thoughts below in the comments section if you liked this analysis!✌️
🔥Happy trading!✅🚀

What is Nifty Small cap indicating??Nifty Small Cap Vs Nifty-
The small cap index has been outperforming Nifty since the lows made in March 2020. It has again reached a crucial zone of resistance. I can see negativity in various stocks and sectors which i have posted. here is one more reason not to hold on to ur longs.

Nifty Smallcap trying hardSmallcap index digesting all news GDP, Gst Tump on Brics and moving higher breaking 50 SMA after support at 200 SMA. It can aim for ATH on crossing recent LH. RBI meeting on 6th dec is the next event to watch out.

Small cap index showing weakness on weekly chart As per layout of this chart, the smallcap index is highly streched in last 4 four years, keeping in view, there is need to book profit on small cap stocks as these stocks can likely to come down in next 2 years of downtrend, or one can shift in small cap mutual funds for SIP. Directly investing into small cap stocks can be a highly risky at this stage of market which is at all time high.
Please protect your capital or book profit as you made in last 10 years. Right Time will come again to invest in small cap stocks. Downtrend started.
When everyone is greedy, be fearfull and everyone is fearfull, be greedy.

Nifty SmallCap 100 Weekly Chart Analysis
Chart Pattern Identification:
The Nifty SmallCap 100 index is currently trading within a well-defined ascending channel that has held for over 1.5 years. Recently, the price action has shown a Tweezer Bottom/Piercing Pattern near the lower boundary of this channel, which is typically a bullish reversal signal. This pattern indicates strong buying interest at this support level and suggests a potential rebound within the channel.
Key Support and Resistance Levels:
-Support: The lower boundary of the channel, around 17,500–17,700, is acting as a key support level, where the Tweezer Bottom pattern emerged. This level aligns with the channel’s trendline, reinforcing its significance.
-Resistance: Immediate resistance is at the channel’s midline, near 19,200–19,500. If this level is breached, the next resistance lies at the upper channel boundary, around 20,000.
Directional Scenarios:
-Bullish Scenario: A successful rebound from the 17,500–17,700 support and a follow-through above 19,200 could lead to a rally towards the upper channel boundary at around 20,000. Increasing volume on bullish candles would strengthen this scenario.
-Bearish Scenario: If the index fails to hold above 17,500 and closes below the channel, it may signal a breakdown, with potential downside toward the next support level at 16,500.
#Trading #Investing #Stocks #TechnicalAnalysis
