Coforge: Ending Diagonal Signals Exhaustion Near Wave (D) HighCoforge has likely completed Wave c of (D) with a clean ending diagonal near the upper boundary of the multi-month triangle structure. This raises the probability of Wave (D) being complete — if price turns down from here.
Technical View
Ending Diagonal: The final leg into ₹1,986 shows a wedg
Next report date
—
Report period
—
EPS estimate
—
Revenue estimate
—
35.00 INR
8.12 B INR
120.73 B INR
332.14 M
About Coforge Limited
Sector
Industry
CEO
Sudhir Singh
Website
Headquarters
New Delhi
Founded
1992
Identifiers
2
ISININE591G01025
Coforge Ltd. engages in the provision of digital services and business solutions in selected verticals, which include banking and financial services, insurance and travel and transportation, and hospitality. It offers services relating to digital, infrastructure management, application development and management, business process, robotic process automation, and geographical information services. The company was founded by Rajendra Singh Pawar and Vijay Kumar Thadani on May 13, 1992 and is headquartered in New Delhi, India.
Related stocks

"COFORGE" CUP & HANDLE IS HERECOFORGE is at make and break stage
the chart and pattern which i am showing is in WEEKLY time frame,Weekly time frame is suggesting that this stock is at make/break level.Let me explain why because this price level is knocking the door of TRIPLE TOP to break previous high if it breaks successfully

COFORGE 1 Day Time Frame 📈 Current Price & Range (as on recent close)
Last traded price: ~ ₹1,966.20
Day’s low–high: ~ ₹1,917.80 – ₹1,986.00
🧭 Key Moving‑Average & Technical Context
On daily chart, short‑ and medium‑term SMAs/EMAs (5‑, 10‑, 20‑, 50‑, 100‑, 200‑day) are all in “outperform” configuration — indicating bull
COFORGE HAVING INVERSE H & S There is a inverse head & shoulder pattern formeg in COFORGE, we can see and easily can find in this chart. And not only inverse h&s formed but neckline broken as well may be chance of good buying.
If someone interested to buy or sell please note it is not my buy/sell call. I am trying to show you

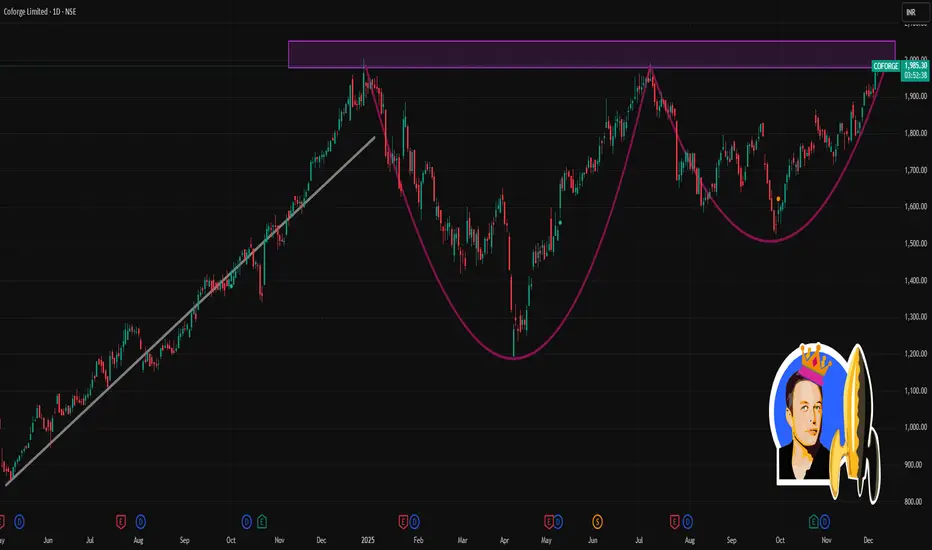
Coforge (D): Strongly Bullish, Triple Top BreakoutTimeframe: Daily | Scale: Linear
The stock has confirmed a major breakout from a 6-month consolidation structure. By closing above the triple-test resistance zone, the "bearish" triple top pattern has been invalidated and converted into a bullish breakout .
📈 1. The Long-Term Structure (The Rev

COFORGE- BREAKOUT FROM FIBO ZONESwing analysis of COFORGE depicts clear breakout from fibonacci levels on weekly chart poised for perfect 1:2 Risk reward. Any retracement should be considered as an opportunity to buy. All our Stock ideas for positional and intraday trades are based on Fibo setups with consistent Risk Reward.

COFORGE - Bullish Breakout Swing Trade Setup💹 Coforge Ltd (NSE: COFORGE)
Sector: IT Services & Consulting | CMP: 1910.20 | View: Bullish Breakout Swing Trade Setup
The COFORGE price structure has begun to reveal a controlled, conviction-based transition from consolidation to momentum. The latest bullish candle wasn’t just a breakout attempt

Bullish above 1850Strong above ₹1,850, targeting ₹2,100-₹2,200 (Fib 161.8% extension from Sep low)
Trade Idea: Buy dips to ₹1,750-₹1,770 (SL ₹1,700). Positional hold for 15-20% returns; R:R ~1:3.
NSE:COFORGE strong above 1850! 📈 Q2 rev +32% YoY, PAT +86% on deal ramps – margins expanding QoQ. Fundamentals acceler

Coforge Ltd.(COFORGE)Time Cycle is a routine that allows you to map the movement of a stock by measuring the high and low levels of the stock on a day or period. However, it does not prove whether a reversal will occur in the next time cycle; it is only a probability. But it makes you profitable 80% of the time.
Regard

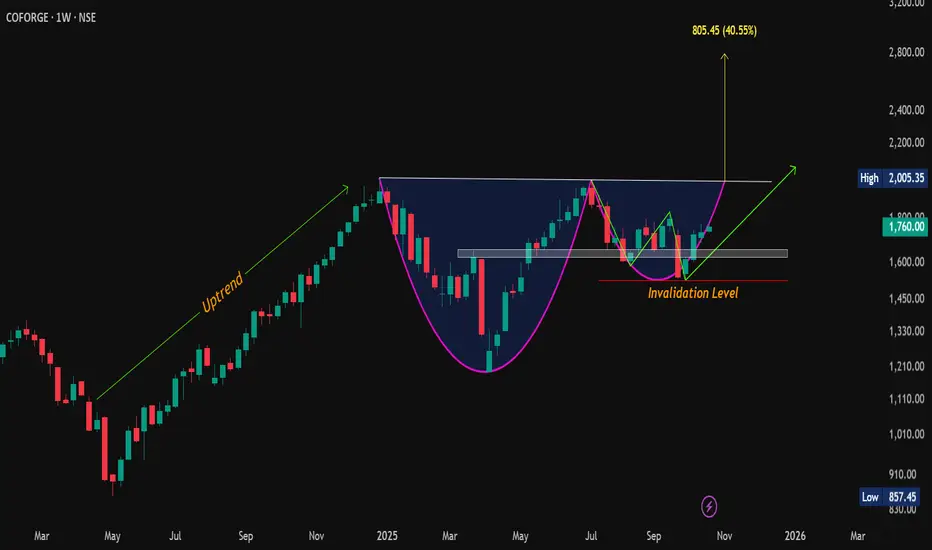
Pattern Inside a Pattern! Cup & Handle Meets the W on #Coforge💰 CMP: 1760
🎯 Cup & Handle Target: 2790 (~58% from cmp)
⚡️ W-Pattern Target: 2060
🧱 Supports: 1658-1622 / 1584
🚧 Resistances: 1795-1830 / 1950-2005
❌ Invalidation: Weekly Close Below 1525
📈 Bullish setup loading… watch for breakout above neckline!
#Coforge | #CupAndHandle | #WPattern
See all ideas
Summarizing what the indicators are suggesting.
Neutral
SellBuy
Strong sellStrong buy
Strong sellSellNeutralBuyStrong buy
Neutral
SellBuy
Strong sellStrong buy
Strong sellSellNeutralBuyStrong buy
Neutral
SellBuy
Strong sellStrong buy
Strong sellSellNeutralBuyStrong buy
An aggregate view of professional's ratings.
Neutral
SellBuy
Strong sellStrong buy
Strong sellSellNeutralBuyStrong buy
Neutral
SellBuy
Strong sellStrong buy
Strong sellSellNeutralBuyStrong buy
Neutral
SellBuy
Strong sellStrong buy
Strong sellSellNeutralBuyStrong buy
Displays a symbol's price movements over previous years to identify recurring trends.
Frequently Asked Questions
The current price of COFORGE is 1,780.20 INR — it has decreased by −4.74% in the past 24 hours. Watch Coforge Limited stock price performance more closely on the chart.
Depending on the exchange, the stock ticker may vary. For instance, on NSE exchange Coforge Limited stocks are traded under the ticker COFORGE.
COFORGE stock has fallen by −4.65% compared to the previous week, the month change is a −3.09% fall, over the last year Coforge Limited has showed a −5.81% decrease.
We've gathered analysts' opinions on Coforge Limited future price: according to them, COFORGE price has a max estimate of 3,000.00 INR and a min estimate of 1,260.00 INR. Watch COFORGE chart and read a more detailed Coforge Limited stock forecast: see what analysts think of Coforge Limited and suggest that you do with its stocks.
COFORGE reached its all-time high on Dec 30, 2024 with the price of 2,005.35 INR, and its all-time low was 8.30 INR and was reached on Mar 13, 2009. View more price dynamics on COFORGE chart.
See other stocks reaching their highest and lowest prices.
See other stocks reaching their highest and lowest prices.
COFORGE stock is 7.44% volatile and has beta coefficient of 2.13. Track Coforge Limited stock price on the chart and check out the list of the most volatile stocks — is Coforge Limited there?
Today Coforge Limited has the market capitalization of 625.64 B, it has increased by 0.25% over the last week.
Yes, you can track Coforge Limited financials in yearly and quarterly reports right on TradingView.
Coforge Limited is going to release the next earnings report on Jan 22, 2026. Keep track of upcoming events with our Earnings Calendar.
COFORGE earnings for the last quarter are 11.20 INR per share, whereas the estimation was 10.66 INR resulting in a 5.06% surprise. The estimated earnings for the next quarter are 11.09 INR per share. See more details about Coforge Limited earnings.
Coforge Limited revenue for the last quarter amounts to 39.86 B INR, despite the estimated figure of 40.83 B INR. In the next quarter, revenue is expected to reach 41.91 B INR.
COFORGE net income for the last quarter is 3.76 B INR, while the quarter before that showed 3.17 B INR of net income which accounts for 18.40% change. Track more Coforge Limited financial stats to get the full picture.
Coforge Limited dividend yield was 0.94% in 2024, and payout ratio reached 61.78%. The year before the numbers were 1.38% and 57.77% correspondingly. See high-dividend stocks and find more opportunities for your portfolio.
As of Dec 24, 2025, the company has 27.42 K employees. See our rating of the largest employees — is Coforge Limited on this list?
EBITDA measures a company's operating performance, its growth signifies an improvement in the efficiency of a company. Coforge Limited EBITDA is 22.80 B INR, and current EBITDA margin is 14.41%. See more stats in Coforge Limited financial statements.
Like other stocks, COFORGE shares are traded on stock exchanges, e.g. Nasdaq, Nyse, Euronext, and the easiest way to buy them is through an online stock broker. To do this, you need to open an account and follow a broker's procedures, then start trading. You can trade Coforge Limited stock right from TradingView charts — choose your broker and connect to your account.
Investing in stocks requires a comprehensive research: you should carefully study all the available data, e.g. company's financials, related news, and its technical analysis. So Coforge Limited technincal analysis shows the sell today, and its 1 week rating is buy. Since market conditions are prone to changes, it's worth looking a bit further into the future — according to the 1 month rating Coforge Limited stock shows the buy signal. See more of Coforge Limited technicals for a more comprehensive analysis.
If you're still not sure, try looking for inspiration in our curated watchlists.
If you're still not sure, try looking for inspiration in our curated watchlists.