CSBBANK 1 Month Time Frame 📌 Last Closing / Recent Price (delayed data)
• Around ₹505–₹520 range recently, showing strong short‑term price action.
🔍 Short‑Term (1‑Month) Key Levels
📈 Resistance Levels
These are levels where price may face selling pressure in short‑term moves:
R1: ~₹514–₹518 – first resistance zone.
R2:
CSB Bank Ltd.
No trades
Next report date
—
Report period
—
EPS estimate
—
Revenue estimate
—
35.85 INR
5.94 B INR
45.72 B INR
90.00 M
About CSB Bank Ltd.
Sector
Industry
CEO
Pralay Mondal
Website
Headquarters
Thrissur
Founded
1920
IPO date
Dec 4, 2019
Identifiers
2
ISIN INE679A01013
CSB Bank Ltd. engages in the provision of commercial banking services. It operates through the following business segments: Treasury, Corporate/Wholesale Banking, Retail Banking, and Other Banking Operations. The Treasury segment includes trading and investments in Government and corporate debt instruments, equity and mutual funds, derivative trading and foreign exchange operations on proprietary account and for customers. The Corporate/Wholesale Banking segment provides services to large and mid-size corporates and other business entities. The Retail Banking segment offers loan and deposit products to retail and non-resident of India customers. The Other Banking Operations segment focuses on the banking activities like third party product distribution and other banking transactions, not covered under any of the above segments. The company was founded on November 26, 1920 and is headquartered in Thrissur, India.
Related stocks

BUY TODAY SELL TOMORROW for 5%DON’T HAVE TIME TO MANAGE YOUR TRADES?
- Take BTST trades at 3:25 pm every day
- Try to exit by taking 4-7% profit of each trade
- SL can also be maintained as closing below the low of the breakout candle
Now, why do I prefer BTST over swing trades? The primary reason is that I have observed that

CSBBANK : Momentum Breakout with Sector StrengthThis trade is a classic momentum breakout setup. The price had been consolidating in a range since August 2025 and has now broken out with strong volume, indicating fresh participation. The broader finance and banking sector is also showing strength, which adds further confluence to the trade. Addit

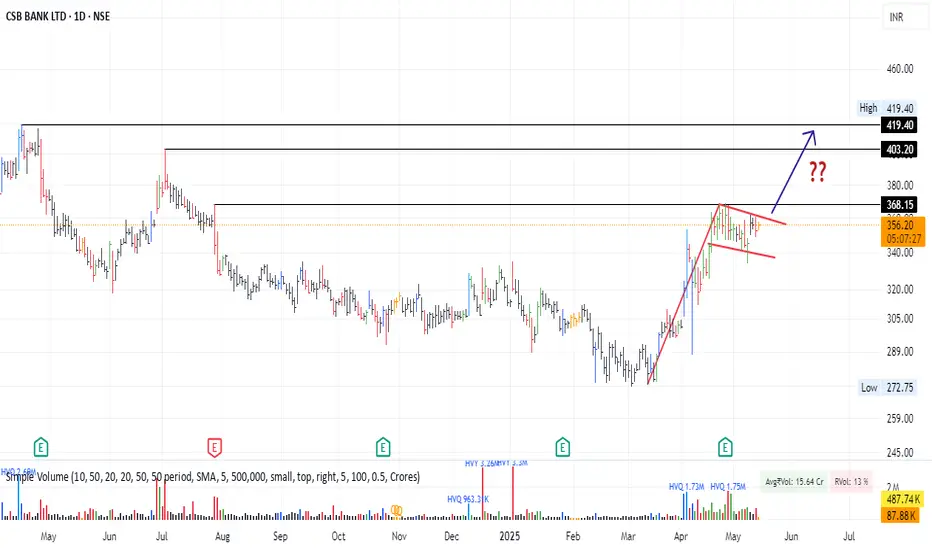
Breakout in CSB Bank Ltd...Chart is self explanatory. Levels of breakout, possible up-moves (where stock may find resistances) and support (close below which, setup will be invalidated) are clearly defined.
Disclaimer: This is for demonstration and educational purpose only. This is not buying or selling recommendations. I am

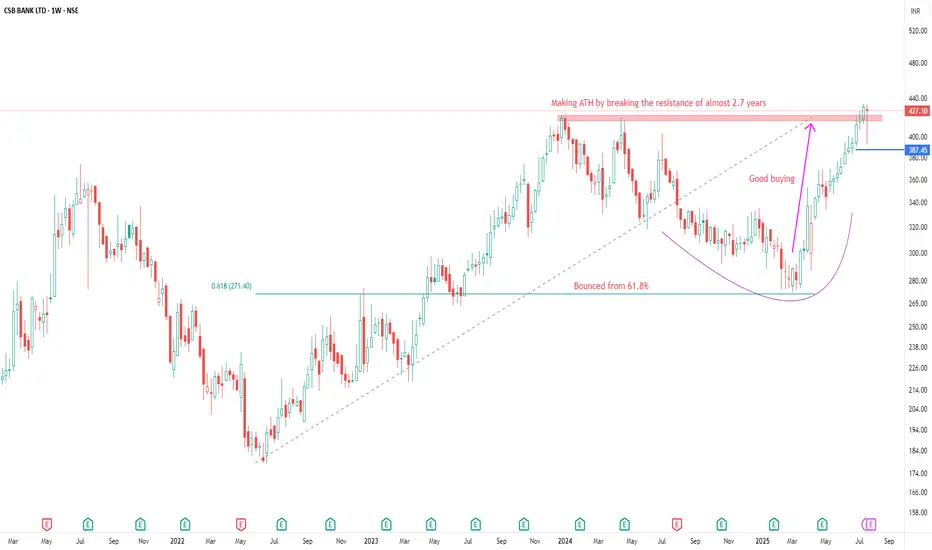
CSB Bank Ltd – Breakout in Motion | ₹427.10Technical Analysis (1M Timeframe)
• Breakout Confirmed: The price has convincingly broken above the consolidation zone (~₹390–₹410), which was acting as resistance since mid-2022.
• Chart Pattern: Symmetrical triangle breakout followed by sustained green candles suggests bullish momentum.
• Suppo

CSB BANK LTD ANALYSISFOR LEARNING PURPOSE
CSB BANK LTD - The current price of CSB BANK LTD is 427.10 rupees
I am going to buy this stock because of the reasons as follows-
1. Its coming out from a good consolidation base
2. It broke a strong resistance zone and it's making a new
CSBBANK : Swing Pick#CSBBANK #BREAKOUTSTOCK #trendingstock
CSBBANK : Swing Trade
>> Breakout Candidate
>> Trending stock
>> Good strength & Volume
>> Good Upside Potential
Swing Traders can lock profit at 10% and keep trailing
Disc : Stock Charts shared are for Learning purpose and not a Trade recommendation.
Consu

Amazing breakout on WEEKLY Timeframe - CSBBANKCheckout an amazing breakout happened in the stock in Weekly timeframe, macroscopically seen in Daily timeframe. Having a great favor that the stock might be bullish expecting a staggering returns of minimum 25% TGT. IMPORTANT BREAKOUT LEVELS ARE ALWAYS RESPECTED!
NOTE for learners: Place the break
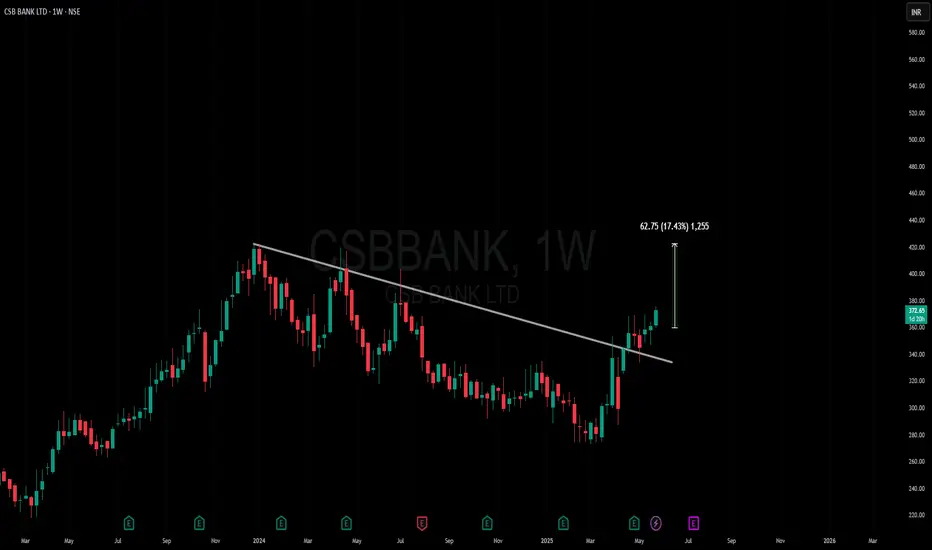
CSB Bank Short Term ViewBreakout above 365 on Closing basis.
Volume:
Volume is less than previous session by 12.67%.
Volatility:
ATR% of the stock is 3.46%
Average of last 20-day is 4.01%
Moving Average Observations:
Price remains above 200-day Moving average.
Price above 50-day, 100-day and 200-day Moving average.

Is CSB Bank ready fo 420 and above levels ?? Looks like a good Flag Structure in making.. Stock moved a nice 20+% on decent volumes. now consolidating..
See all ideas
Summarizing what the indicators are suggesting.
Neutral
SellBuy
Strong sellStrong buy
Strong sellSellNeutralBuyStrong buy
Neutral
SellBuy
Strong sellStrong buy
Strong sellSellNeutralBuyStrong buy
Neutral
SellBuy
Strong sellStrong buy
Strong sellSellNeutralBuyStrong buy
An aggregate view of professional's ratings.
Neutral
SellBuy
Strong sellStrong buy
Strong sellSellNeutralBuyStrong buy
Neutral
SellBuy
Strong sellStrong buy
Strong sellSellNeutralBuyStrong buy
Neutral
SellBuy
Strong sellStrong buy
Strong sellSellNeutralBuyStrong buy
Displays a symbol's price movements over previous years to identify recurring trends.
Frequently Asked Questions
The current price of CSBBANK is 375.50 INR — it has decreased by −3.62% in the past 24 hours. Watch CSB Bank Ltd. stock price performance more closely on the chart.
Depending on the exchange, the stock ticker may vary. For instance, on NSE exchange CSB Bank Ltd. stocks are traded under the ticker CSBBANK.
CSBBANK stock has fallen by −6.13% compared to the previous week, the month change is a −25.45% fall, over the last year CSB Bank Ltd. has showed a 26.32% increase.
We've gathered analysts' opinions on CSB Bank Ltd. future price: according to them, CSBBANK price has a max estimate of 525.00 INR and a min estimate of 410.00 INR. Watch CSBBANK chart and read a more detailed CSB Bank Ltd. stock forecast: see what analysts think of CSB Bank Ltd. and suggest that you do with its stocks.
CSBBANK reached its all-time high on Jan 5, 2026 with the price of 574.40 INR, and its all-time low was 95.60 INR and was reached on Mar 25, 2020. View more price dynamics on CSBBANK chart.
See other stocks reaching their highest and lowest prices.
See other stocks reaching their highest and lowest prices.
CSBBANK stock is 4.71% volatile and has beta coefficient of 0.42. Track CSB Bank Ltd. stock price on the chart and check out the list of the most volatile stocks — is CSB Bank Ltd. there?
Today CSB Bank Ltd. has the market capitalization of 67.37 B, it has decreased by −1.81% over the last week.
Yes, you can track CSB Bank Ltd. financials in yearly and quarterly reports right on TradingView.
CSB Bank Ltd. is going to release the next earnings report on Apr 30, 2026. Keep track of upcoming events with our Earnings Calendar.
CSBBANK net income for the last quarter is 1.53 B INR, while the quarter before that showed 1.60 B INR of net income which accounts for −4.78% change. Track more CSB Bank Ltd. financial stats to get the full picture.
No, CSBBANK doesn't pay any dividends to its shareholders. But don't worry, we've prepared a list of high-dividend stocks for you.
As of Feb 16, 2026, the company has 7.62 K employees. See our rating of the largest employees — is CSB Bank Ltd. on this list?
Like other stocks, CSBBANK shares are traded on stock exchanges, e.g. Nasdaq, Nyse, Euronext, and the easiest way to buy them is through an online stock broker. To do this, you need to open an account and follow a broker's procedures, then start trading. You can trade CSB Bank Ltd. stock right from TradingView charts — choose your broker and connect to your account.
Investing in stocks requires a comprehensive research: you should carefully study all the available data, e.g. company's financials, related news, and its technical analysis. So CSB Bank Ltd. technincal analysis shows the strong sell today, and its 1 week rating is sell. Since market conditions are prone to changes, it's worth looking a bit further into the future — according to the 1 month rating CSB Bank Ltd. stock shows the buy signal. See more of CSB Bank Ltd. technicals for a more comprehensive analysis.
If you're still not sure, try looking for inspiration in our curated watchlists.
If you're still not sure, try looking for inspiration in our curated watchlists.