BUY TODAY SELL TOMORROW for 5%DON’T HAVE TIME TO MANAGE YOUR TRADES?
- Take BTST trades at 3:25 pm every day
- Try to exit by taking 4-7% profit of each trade
- SL can also be maintained as closing below the low of the breakout candle
Now, why do I prefer BTST over swing trades? The primary reason is that I have observed that 90% of the stocks give most of the movement in just 1-2 days and the rest of the time they either consolidate or fall
Channel breakout in CSBBANK
BUY TODAY SELL TOMORROW for 5%
CSB Bank Ltd.
No trades
No trades
In-depth trading ideas
CSB Bank – History Repeating? Inside a Powerful Rising StructureThis chart is showing something very interesting from a bigger-picture perspective. CSB Bank has been moving inside a strong rising structure for years, and every time the stock touches the lower zone of the channel, buyers slowly start stepping in again.
What makes this setup special is the repeating behavior.
In the past, whenever the stock corrected deeply and reached the lower part of the structure, it eventually bounced back with a strong rally. These rallies were not small moves — they t
CSBBANK 1 Month Time Frame 📌 Last Closing / Recent Price (delayed data)
• Around ₹505–₹520 range recently, showing strong short‑term price action.
🔍 Short‑Term (1‑Month) Key Levels
📈 Resistance Levels
These are levels where price may face selling pressure in short‑term moves:
R1: ~₹514–₹518 – first resistance zone.
R2: ~₹530–₹532 – next broader resistance if rally continues.
R3: ~₹543–₹557 – higher resistance area in 1‑month horizon.
Tactical View: Break above ~₹532–₹543 could signal continuation to higher short‑
BUY TODAY SELL TOMORROW for 5%DON’T HAVE TIME TO MANAGE YOUR TRADES?
- Take BTST trades at 3:25 pm every day
- Try to exit by taking 4-7% profit of each trade
- SL can also be maintained as closing below the low of the breakout candle
Now, why do I prefer BTST over swing trades? The primary reason is that I have observed that 90% of the stocks give most of the movement in just 1-2 days and the rest of the time they either consolidate or fall
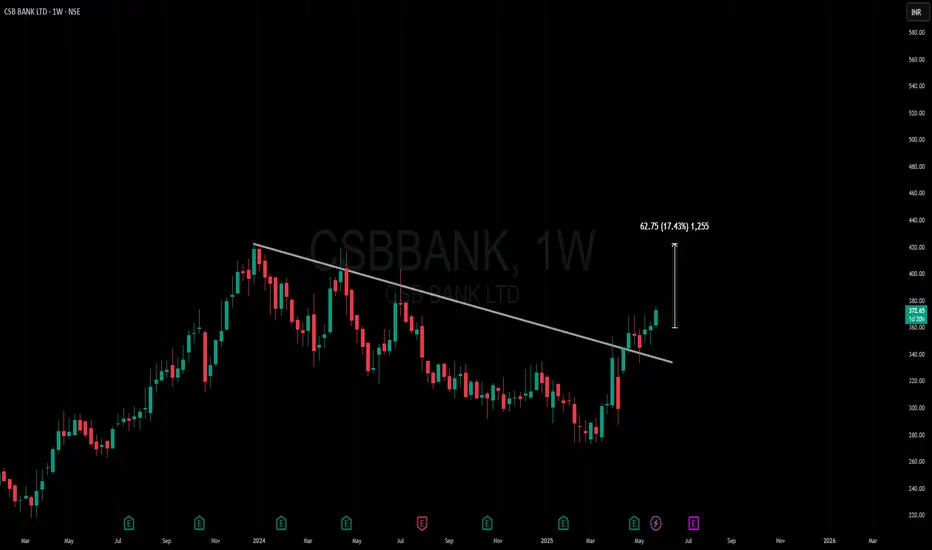
Trendline Breakout in CSBBANK
BUY TODAY SELL TOMORROW for 5%
CSBBANK : Momentum Breakout with Sector StrengthThis trade is a classic momentum breakout setup. The price had been consolidating in a range since August 2025 and has now broken out with strong volume, indicating fresh participation. The broader finance and banking sector is also showing strength, which adds further confluence to the trade. Additionally, recent sales and EPS growth have been encouraging, supporting the bullish bias from a fundamentals perspective.
The only concern is that the price is currently extended from the 20 and 50 EM
Breakout in CSB Bank Ltd...Chart is self explanatory. Levels of breakout, possible up-moves (where stock may find resistances) and support (close below which, setup will be invalidated) are clearly defined.
Disclaimer: This is for demonstration and educational purpose only. This is not buying or selling recommendations. I am not SEBI registered. Please consult your financial advisor before taking any trade.
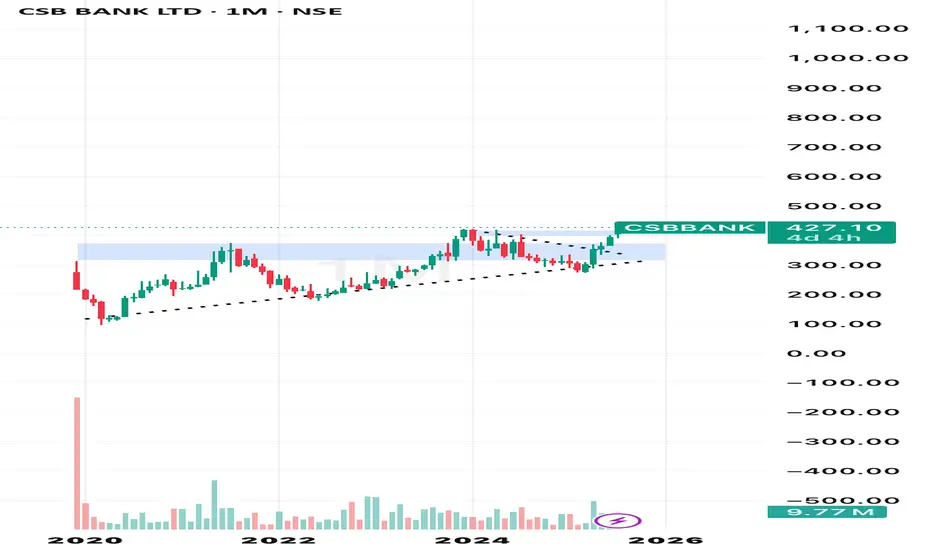
CSB Bank Ltd – Breakout in Motion | ₹427.10Technical Analysis (1M Timeframe)
• Breakout Confirmed: The price has convincingly broken above the consolidation zone (~₹390–₹410), which was acting as resistance since mid-2022.
• Chart Pattern: Symmetrical triangle breakout followed by sustained green candles suggests bullish momentum.
• Support Levels: ₹360–₹380 (former resistance now acting as support).
• Resistance Levels: Next resistance seen around ₹460–₹480 (historic highs).
• Volume: Healthy volume uptick on breakout, adding confi
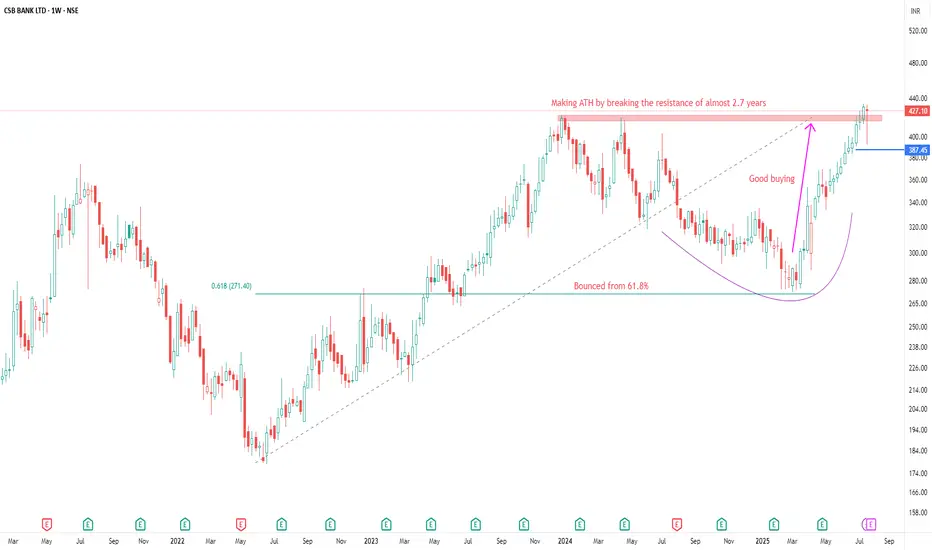
CSB BANK LTD ANALYSISFOR LEARNING PURPOSE
CSB BANK LTD - The current price of CSB BANK LTD is 427.10 rupees
I am going to buy this stock because of the reasons as follows-
1. Its coming out from a good consolidation base
2. It broke a strong resistance zone and it's making a new ATH and retested that level last week.
3. It is showing better relative strength as it stood strong in volatile times including last week.
4. The risk and reward is favourable. The
CSBBANK : Swing Pick#CSBBANK #BREAKOUTSTOCK #trendingstock
CSBBANK : Swing Trade
>> Breakout Candidate
>> Trending stock
>> Good strength & Volume
>> Good Upside Potential
Swing Traders can lock profit at 10% and keep trailing
Disc : Stock Charts shared are for Learning purpose and not a Trade recommendation.
Consult a SEBI Registered Advisor before taking position in it.
Amazing breakout on WEEKLY Timeframe - CSBBANKCheckout an amazing breakout happened in the stock in Weekly timeframe, macroscopically seen in Daily timeframe. Having a great favor that the stock might be bullish expecting a staggering returns of minimum 25% TGT. IMPORTANT BREAKOUT LEVELS ARE ALWAYS RESPECTED!
NOTE for learners: Place the breakout levels as per the chart shared and track it yourself to get amazed!!
#No complicated chart patterns
#No big big indicators
#No Excel sheet or number magics
TRADE IDEA: WAIT FOR THE STOCK TO BREA
CSB Bank Short Term ViewBreakout above 365 on Closing basis.
Volume:
Volume is less than previous session by 12.67%.
Volatility:
ATR% of the stock is 3.46%
Average of last 20-day is 4.01%
Moving Average Observations:
Price remains above 200-day Moving average.
Price above 50-day, 100-day and 200-day Moving average.
RSI Observations:
The Daily RSI indicator has remained above 50. This is a bullish zone. Current Daily RSI reading is 60.95.
The Weekly RSI indicator has remained above 50. This is a bullish zone.
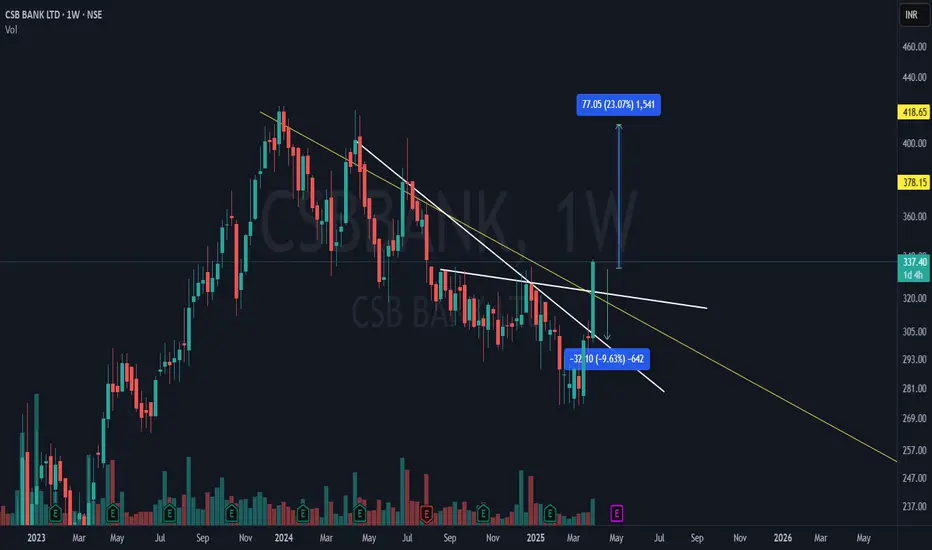
CSB Bank | WTF Breakout – Can Bulls Sustain? 📈 Stock: CSB BANK LTD (NSE)
Key Breakout Signals:
✅ CT Resistance (White Line) – Broken! A solid breakout on the weekly timeframe (WTF).
✅ Hidden Resistance Cleared! The lower white trendline resistance has been taken out.
✅ Monthly Resistance Ahead (Yellow Line)! Price approaching the higher timeframe barrier.
✅ Massive Volume Surge: Buyers stepping in strongly – Friday’s close will confirm!
🔥 A classic CT-based breakout setup with strong volume! Will bulls conquer the monthly resistance? Dro
CSB Bank Stock: Gaining Momentum!The CSB Bank stock chart is displaying notable strength, with positive technical indicators signaling potential upward momentum. Traders and investors, this might be the right moment to keep a close watch! 📈
Whether you're in for short-term gains or long-term growth, it's worth analyzing the trend closely. Share your thoughts or trading strategies related to CSB Bank in the comments below! 💬
#StockMarket #CSBBank #InvestSmart #TradingOpportunities
CSB BANK - LONGCSB BANK LTD - 1W NSE
Symbol: CSB BANK
Current Price: 318.20
Change: +7.50 (+2.41%)
Technical Analysis:
This could be a great entry point for CSB BANK! It's currently sitting in the golden zone of the Fibonacci retracement (around the 0.618 level) AND at the lower end of the channel. We could see a bounce from here back up to the upper channel trendline. Keep an eye on those trendlines as they're likely to act as resistance levels.
Possible Scenario:
Bullish: A break above the trendline resi
CSB Bank LTD Analyasis on 30 Mar 24CSB Bank LTD Analyasis on 30 Mar 24
Stock Fundamental Analysis
Fundamentally strong stock
Promoter holding 49%
FII Holding 4.65%
Stock PE less than industry PE
Stock PE - 10.75
Industry PE - 11.26
CSB Bank LTD Analyasis on 30 Mar 24
Stock Technical Analysis
breakout after Jan 2021 @ 360
and support near 330 to 360
take support near weekly supertrend and 50 EMA
Keep stoploss near 260 (below 200 EMA @ 268)
Target 370 - 400 - 450 -500
and breakout target 530
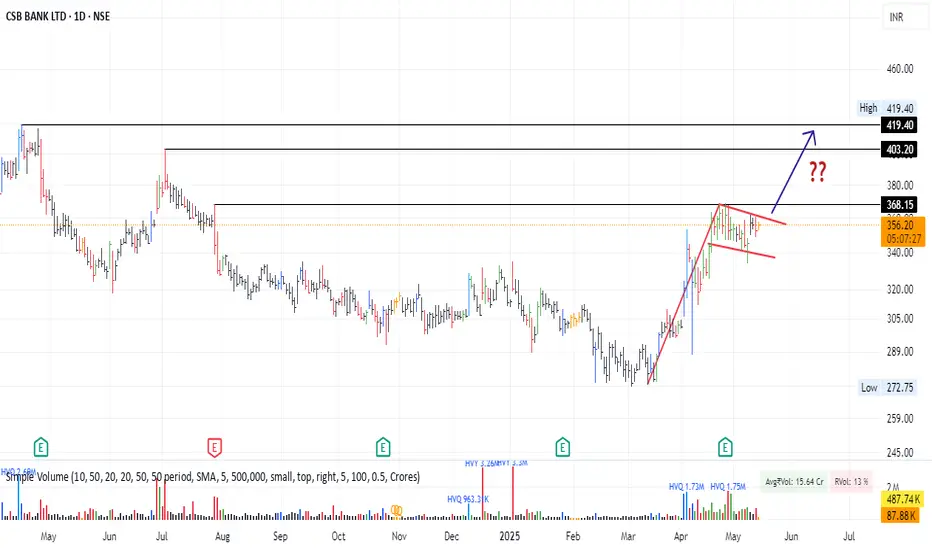
Daily Bullish Flag Breakout in CSB BANKHi,
NSE:CSBBANK has given a Bullish Flag Breakout on Daily charts with very good volume.
MACD is also on the bullish side on daily and monthly time frames. RSI is also on the bullish side on daily and weekly time frames.
In the current market scenario I am expecting that the bullish momentum will continue.
Complete price projection like entry, stoploss and targets mentioned on the charts for educational purpose.
Please share your feedback or any queries on the study.
Disclaimer: Please co