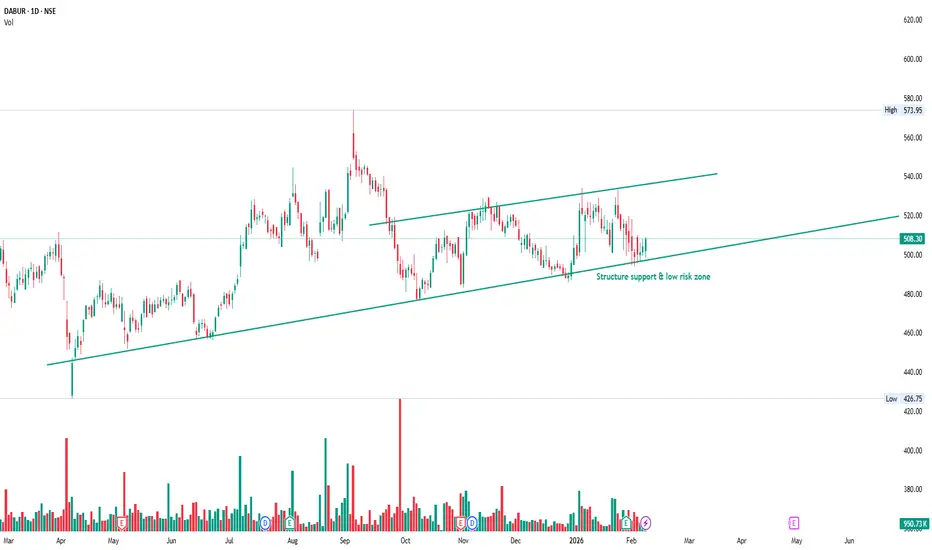
DABUR – Rising Channel Support | Low Risk, High Clarity SetupPrice is trading inside a well-defined rising channel and has now pulled back to the lower boundary of the structure.
This area has repeatedly acted as dynamic support, making risk clearly visible and controllable.
No prediction here — only structure and location.
As long as price holds above chann
Dabur India Limited
No trades
Next report date
—
Report period
—
EPS estimate
—
Revenue estimate
—
10.40 INR
17.68 B INR
124.47 B INR
573.88 M
About Dabur India Limited
Sector
Industry
CEO
Mohit Malhotra
Website
Headquarters
Ghaziabad
Founded
1884
IPO date
Jun 8, 1905
Identifiers
2
ISIN INE016A01026
Dabur India Ltd. engages in the distribution of fast moving consumer goods. It operates through the following segments: Consumer Care Business, Foods Business, and Other. The Consumer Care Business segment is involved in providing home care, personal care, and health care. The Foods Business segment offers packaged fruit juices, beverages, and culinary. The Other segment includes guar gum, pharma, and others. The company was founded in 1884 and is headquartered in Ghaziabad, India.
Related stocks
DABUR: Bearish Head & Shoulders Pattern in the Making?Market Insights by Ayushi Shrivastava | NISM-Certified Research Analyst
The daily chart of DABUR is flashing an important technical warning signal.
As of January 26, 2026, a classic Head and Shoulders pattern appears to be forming, with price now hovering around ₹519 — right near a critical support

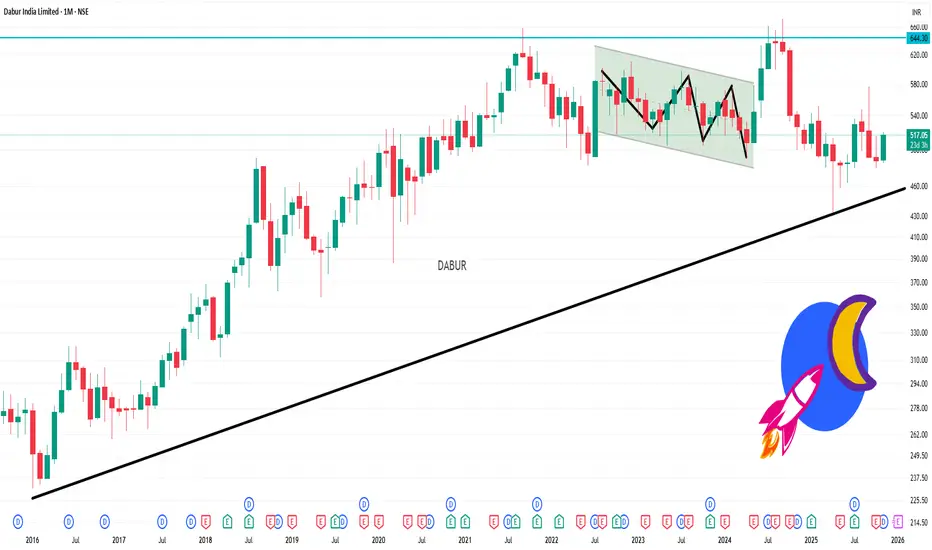
Dabur India Ltd: A Double Zigzag Within DistributionThe rally into the 577 high marked the completion of a mature advance, with momentum clearly fading near the top. Since then, price action has transitioned into a corrective phase.
The decline from 577 is unfolding as a higher-degree W–X–Y correction . Within this structure, the bounce from 4

Dabur India LtdA long-term descending trendline (dashed blue) originating from late 2024 has been decisively broken on the upside.
The stock has broken out after a multi-month consolidation, indicating a potential trend reversal or a strong bullish swing in the short to medium term.
⚠️ Disclaimer
This analysis i

DABURclosed above 200 dma 501.62 with increased vilume. investment transfering to traditional stocks.

A Change of Character (ChoCh) in Smart Money ConceptA Change of Character (ChoCh) in Smart Money Concept signals a potential trend reversal, and Dabur India Ltd trading near ₹498 on the hourly chart is showing such a setup, hinting at a possible shift from bearish to bullish momentum.
📘 What is Change of Character (ChoCh)?
Definition: In Smart Money

DABUR: a long term breakout candidatePros:
-Defensive sector i.e. FMCG and world’s largest ayurvedic and natural health care company
-P/E in February 2020 > P/E in November 2025
-Promoter holding at 66% & the retail holding is near an all time low
-Highest ever sales and EPS
-Increase in capex and reduction in debt
-RS has been negativ

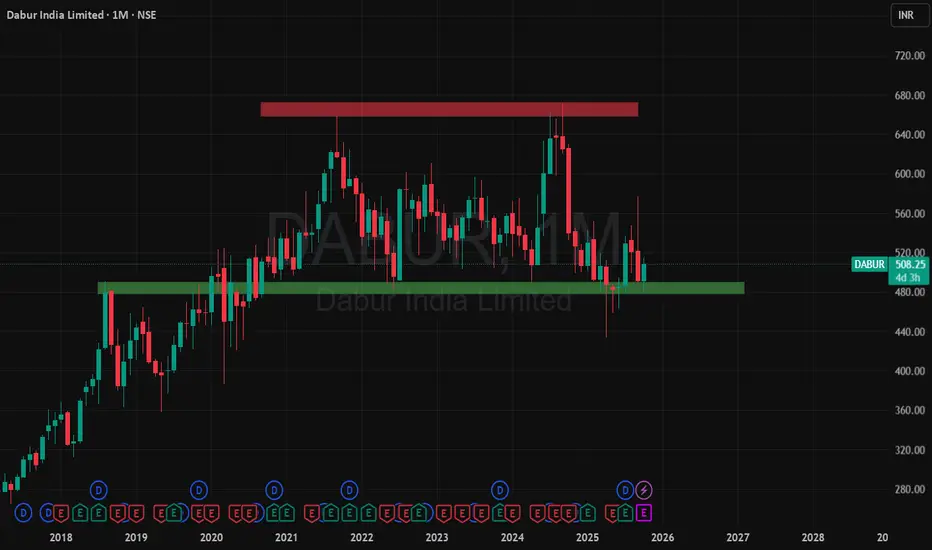
DABUR 1 Month Time Frame 📊 Key Levels to Watch (1-Month horizon)
Based on the technical data:
Major resistance zone: ~ ₹515-₹520 – price has struggled around this level in short term.
Primary support zone: ~ ₹480-₹485 – a level where prior support is noted.
Secondary deeper support: ~ ₹460-₹465 – if weakness persists, th
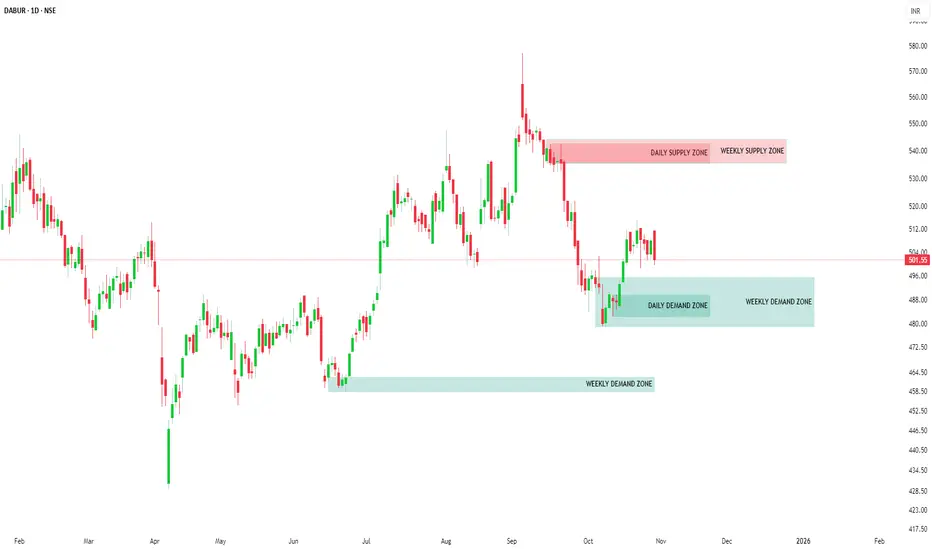
DABUR: Strong Demand Zones | Bullish Upside Setup📊 DABUR: Comprehensive Multi-Timeframe Demand-Supply Analysis
🎯 Executive Summary
This detailed analysis examines Dabur's price action across multiple timeframes using advanced demand-supply methodology. The stock demonstrates strong bullish momentum with multiple coinciding demand zones across
DABUR INDIA – AT A CRUCIAL SUPPORT ZONE1. Company Overview
Dabur India Ltd is one of India’s leading FMCG companies with deep roots in Ayurveda and natural healthcare.
It operates across Home Care, Personal Care, Healthcare, and Foods, serving both domestic and international markets.
The company’s ongoing strategy focuses on rural
See all ideas
Summarizing what the indicators are suggesting.
Neutral
SellBuy
Strong sellStrong buy
Strong sellSellNeutralBuyStrong buy
Neutral
SellBuy
Strong sellStrong buy
Strong sellSellNeutralBuyStrong buy
Neutral
SellBuy
Strong sellStrong buy
Strong sellSellNeutralBuyStrong buy
An aggregate view of professional's ratings.
Neutral
SellBuy
Strong sellStrong buy
Strong sellSellNeutralBuyStrong buy
Neutral
SellBuy
Strong sellStrong buy
Strong sellSellNeutralBuyStrong buy
Neutral
SellBuy
Strong sellStrong buy
Strong sellSellNeutralBuyStrong buy
Displays a symbol's price movements over previous years to identify recurring trends.
EEDM
iShares IV PLC - iShares MSCI EM CTB Enhanced ESG UCITS ETF Unhedged USDWeight
0.15%
Market value
14.94 M
USD
EDM2
iShares IV PLC - iShares MSCI EM CTB Enhanced ESG UCITS ETF Accum Shs Unhedged USDWeight
0.15%
Market value
14.94 M
USD
AMEG
Amundi MSCI Emerging Markets SRI Climate Paris Aligned -UCITS ETF DR- DistributionWeight
0.46%
Market value
12.74 M
USD
MSDU
Amundi MSCI Emerging Markets SRI Climate Paris Aligned UCITS ETF DR (D)Weight
0.46%
Market value
12.74 M
USD
AMEI
Amundi MSCI Emerging Markets SRI Climate Paris Aligned UCITS ETF DR C- CapitalisationWeight
0.46%
Market value
12.74 M
USD
Explore more ETFs
Frequently Asked Questions
The current price of DABUR is 518.65 INR — it has decreased by −0.71% in the past 24 hours. Watch Dabur India Limited stock price performance more closely on the chart.
Depending on the exchange, the stock ticker may vary. For instance, on NSE exchange Dabur India Limited stocks are traded under the ticker DABUR.
DABUR stock has risen by 3.41% compared to the previous week, the month change is a −1.21% fall, over the last year Dabur India Limited has showed a 0.07% increase.
We've gathered analysts' opinions on Dabur India Limited future price: according to them, DABUR price has a max estimate of 615.00 INR and a min estimate of 490.00 INR. Watch DABUR chart and read a more detailed Dabur India Limited stock forecast: see what analysts think of Dabur India Limited and suggest that you do with its stocks.
DABUR reached its all-time high on Sep 17, 2024 with the price of 672.00 INR, and its all-time low was 5.15 INR and was reached on May 7, 2003. View more price dynamics on DABUR chart.
See other stocks reaching their highest and lowest prices.
See other stocks reaching their highest and lowest prices.
DABUR stock is 1.03% volatile and has beta coefficient of 0.74. Track Dabur India Limited stock price on the chart and check out the list of the most volatile stocks — is Dabur India Limited there?
Today Dabur India Limited has the market capitalization of 921.34 B, it has decreased by −1.82% over the last week.
Yes, you can track Dabur India Limited financials in yearly and quarterly reports right on TradingView.
Dabur India Limited is going to release the next earnings report on Apr 30, 2026. Keep track of upcoming events with our Earnings Calendar.
DABUR earnings for the last quarter are 3.15 INR per share, whereas the estimation was 3.04 INR resulting in a 3.77% surprise. The estimated earnings for the next quarter are 2.18 INR per share. See more details about Dabur India Limited earnings.
Dabur India Limited revenue for the last quarter amounts to 35.59 B INR, despite the estimated figure of 35.54 B INR. In the next quarter, revenue is expected to reach 30.64 B INR.
DABUR net income for the last quarter is 5.60 B INR, while the quarter before that showed 4.53 B INR of net income which accounts for 23.74% change. Track more Dabur India Limited financial stats to get the full picture.
Dabur India Limited dividend yield was 1.58% in 2024, and payout ratio reached 80.21%. The year before the numbers were 1.05% and 52.89% correspondingly. See high-dividend stocks and find more opportunities for your portfolio.
As of Feb 12, 2026, the company has 14.9 K employees. See our rating of the largest employees — is Dabur India Limited on this list?
EBITDA measures a company's operating performance, its growth signifies an improvement in the efficiency of a company. Dabur India Limited EBITDA is 24.17 B INR, and current EBITDA margin is 18.19%. See more stats in Dabur India Limited financial statements.
Like other stocks, DABUR shares are traded on stock exchanges, e.g. Nasdaq, Nyse, Euronext, and the easiest way to buy them is through an online stock broker. To do this, you need to open an account and follow a broker's procedures, then start trading. You can trade Dabur India Limited stock right from TradingView charts — choose your broker and connect to your account.
Investing in stocks requires a comprehensive research: you should carefully study all the available data, e.g. company's financials, related news, and its technical analysis. So Dabur India Limited technincal analysis shows the buy rating today, and its 1 week rating is buy. Since market conditions are prone to changes, it's worth looking a bit further into the future — according to the 1 month rating Dabur India Limited stock shows the buy signal. See more of Dabur India Limited technicals for a more comprehensive analysis.
If you're still not sure, try looking for inspiration in our curated watchlists.
If you're still not sure, try looking for inspiration in our curated watchlists.