Trade ideas


Dabur Levels To be very honest i am bit biased as winter season as come and demand for its products will boom ass well as they posted well profits last quarter and expecting next results is profits too.Moreover, stock has tried to break 501 multiple time.I have bought at 506 Jan fut target price 530, SL 498 or if it crash i will hedge for short time.

DABUR NEXT POSSIBLE TARGET IN WEEKLYDABUR NEXT TARGET IN WEEKLY. IF ANYONE LOOKING IDEAS ABOUT ANY EQUITY OR COMMODITY SCRIPT LET ME KNOW IN COMMENT SECTION . I WILL POST MY VIEW.


DABUR - SELLING CLIMAX VISIBLEDABUR INTO SIDEWAYS ZONE - IF SUSTAINS 490(CBSL) CAN ACCUMLATE AND GO AGAIN UPTO 550 AREAS

DABUR COMING TO BUY ZONEDABUR COMING NEAR HARMONIC BUY ZONE
DABUR
BUY @ 484-486
SL - 474 (1HR CANDLE CLOSE)
TARGET - 492, 498, 505
POSITIONAL CALL - HOLD FOR 3 TO 6 DAYS

NSE:DABUR
DISCLAIMER : . I am not a SEBI Registered analyst.
All chart analysis I publish are educational and information purposes only

#DABUR WEEKLY CHART VIEW!!#DABUR WEEKLY CHART VIEW!!
The stock price is trading with negative bias and has broken down short term rectangular pattern.
Closing below 500, near weekly low indicates weakness.
Below 490 we can see a dip towards 485-483-480 levels.
On the upside 505-508-510-512-515 are short term resistances.


DABUR - About to go downDABUR is about to come down, as it broke the channel pattern, retraced back and ready for a bigger move.
SHORT RISK/REWARDS are mentioned in the chart.
Target - 494.75, 480.15
SL - 507.8


Dabur Make or Break levels Good for Swing or short Dabur Make or Break levels Good for Swing or short
KEEP EYE


Dabur - Double Bottom - LongDabur has formed double bottom at 505.10
If the script cross above 535 go for Long.
SL - 500
Target - 566.05
Disclaimer: Kindly do your own analysis before executing the trade

Dabur long entry can be taken.Well supported at the level of 505. Dabur stock is in uptrend. Long entry above 510 after the BO confirmation above all conflux area. EMA 20, TL. Target price 530-535 SL 498. Good risk to reward ratio.This is for your educational purpoise

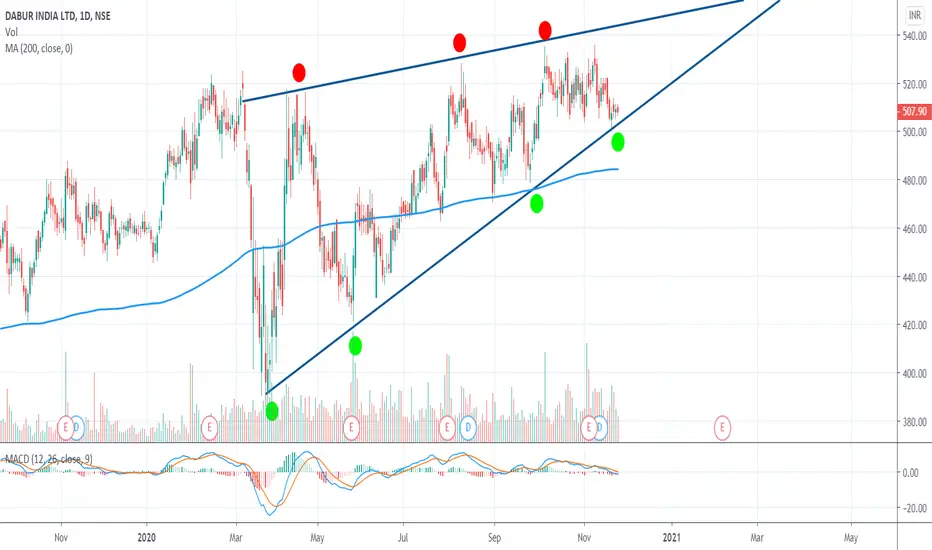
Dabur reversing from a strong supportDabur has tested the same trendline numerous times and this could be a great entry point to go long in the stock.
NSE:DABUR
Please like and follow.
