DABURDABUR:--
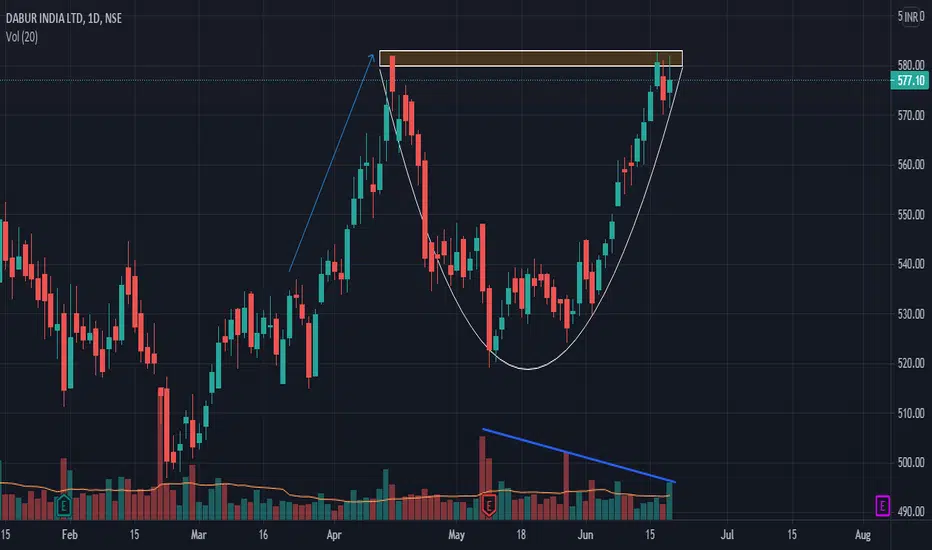
* MAJOR TREND IS UP
* UNTILL TODAY IT LOOKS LIKE A DOUBLE TOP
* TODAY LOOKS CUP AND CANDLE
* VOLUME LOOKS GOOD
* LETS CHECK WETHER IT FORMS TRIPLE TOP
OR NOT FOR GO LONG
* MY UPSIDE TGT 646
* LONG ABOVE 1ST JULY HIGH IS GOOD
DABUR trade ideas

DABURNote:
1. Views are personal and for educational purposes only. Recheck and take the trade as per your RR.
2. Always remember SL is your lifeline, not the big target...
3.Follow us for more patterns and like, share so that we feel it is helpful to many and share more patterns...
3. Views given here is not a tip rather it is for educational purpose... Aftermarket opens, the condition might change so learn to handle different conditions...
4. To learn more about patterns, Psychology behind the trade, and price action trading... contact us... Thanks...
Keep an eye ladies and gentlemen. Cheers and Happy Trading


Dabur CMP 573 Short add some more if get @ 579-581 Target 565- Dabur CMP 573 Short add some more if get @ 579-581
Target 565- 560-555-550-540+
SL above 590
Can buy 570 PE CMP 5


DABUR FLAG AND POLE PATTERN BREAKOUT POSSIBLE DABUR FLAG AND POLE PATTERN BREAKOUT AND CLOSE COMING DAYS 40 POINT MOVE POSSIBLE


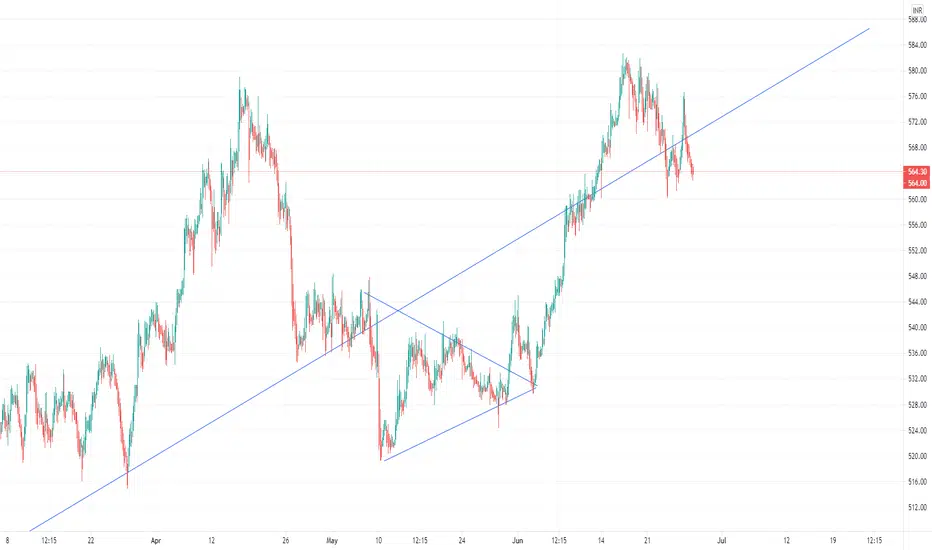
DaburDabur is in a channel pattern for a long time. Wait for it to break the resistance line and close above it. Can go for buy if the hourly or daily candle closes above 585.


Dabur Breakout - RepostDabur Good Breakout
Buy Dabur
Closing Price - 566.45
SL - 518 (Weekly Closing Basis)
Target - 700

Dabur making Bullish Flag ?If 582 level will Break with Good Volume Confirmation and candle Close Above this Resistance Then We can buy for Swing Trade.
-> Always Enter With good confirmation & Maintain proper Risk Reward.
*******Knowledge Purpose only********
--->> Visit my Ideas Page for Daily Stock Analysis and check my previous stock analysis performance. I usually prefer Swing & Intraday Trades with Good Breakout confirmations and Best Risk Reward Stocks.

DABUR : Bearish trend has started.TECHNICAL ANALYSIS OF NSE:DABUR
The LAST CLOSE PRICE of NSE:DABUR is 566.65. The PARABOLIC SAR is showing the SELL SIGNAL with TREND as DOWN TREND . The FIBONACCI LEVELS analysis shows that the C LOSEST FIBONACCI LEVELS is 0.236 at the FIBONACCI STOCK PRICE LEVEL of 566.25. From here, the Key Support and Resistance levels are SUPPORT 1 at 567.74, SUPPORT 2 at 503.94 with RESISTANCE 1 and RESISTANCE 2 at 558.2 and 551.15 respectively. The Key 50% FIBONACCI LEVEL stands at 551 which is the crucial Fibonacci Level determining whether the scrip will maintain the trend or not.
The STOC RSI has the values K and D as 53.51 and 34 respectively. At this level it the status is WITHIN OVER BOUGHT AND OVER SOLD RANGE . When we look at the Moving Averages, MACD is the crucial indicator to look into. With MACD VALUE at 9.02 and SIGNAL at 7.81 alongwith HISTOGRAM showing values of 0.9, the STATUS is clearly SELL CROSSOVER NEARING IN.
The best indicator to determine the Trend Reversal is FISHER TRANSFORM and currently the values of FISHER and TRIGGER stand at 1.23 and 2.02 with SIGNAL as DOWNTREND . A very important factor while making the investment is to see if there has been already too much of Buying or Selling, and that are we entering too late into the transaction or not. Thus, with WILLIAM's R% value at -0.3684 the STATUS is WITHIN OVER BOUGHT AND OVER SOLD RANGE.
No one wants to buy costly things, and thus always look for the bargain or appropriate price levels to buy things. Same applies to Stocks, however the only exception would be some Hot Stocks that one wants to have any price. Looking at this perspective, the P/E RATIO of the stock stands at 59.33 which signifies its Price Level to be TOO EXPENSIVE.
>>> RECOMMENDATION is : SELL.
Disclaimer:
The analysis is only for illustration purposes only. Please consult your financial advisor, agent, broker before acting on any information. We may or may not have positions in the stock and our actions may be contrary to the one mentioned here. This analysis may or may not be updated. We would not be responsible for the profit/loss resulting from this analysis.

DABUR 🍯🐝 analysis Take trade as per the values given in Fibonacci. always trail the stop loss. do your own analysis before taking trade
Check these Upcoming ideas - STILL ACTIVE
Check these successful trades & approach on HDFC , HINDUNILEVER, INFOSYS , MOTHERSUMI , DLF , BRITANNIA
If you like my analysis do like & follow me as a token of appreciation. If you have any queries on any stock let me know.
Leave a comment that is helpful or encouraging. Let's master the markets together


DABUR "Udega" Trade || 30 mins ChartI will be going long tomorrow on the stock if it follows my setup after the first candle closing of 30 mins. Stay Tuned !!

#77 DABUR - DAB#77 (GENIE IDEAS): I will daily post intraday/swing/positional trading opportunities so u can analyse and get the most from it. if you like my analysis do like and follow me as a token of appreciation.and if you have any queries let me know.I HAVE LINKED MY PREVIOUS POSTS ON DABUR BELOW .
Leave a comment that is helpful or encouraging. Let's master the markets together .


DABUR NeutralDabur is moving in a range from the last 4-5 days...keep an eye on it.
Could give a good move after range breakout and retest.


DABUR INDIA: A MAJOR CONSOLIDATIONAs we can see the stock is behaving so normal between the range of 572 to 580 and if it will cross 582 then it can move to higher levels.
As a risky trader you can also take risk while buyiing the levels of 572 and sell it when it goes till 580.
But play on your own risk.

DABUR: Move for breakoutI purchased Dabur as a call option 2 days before. I booked the loss in this call option. So based on my experience i am sharing my views on the stock.
- The stock is showing a daily rally of 572 to 580 levels.
- The major resistance is on 580. If it crosses the major resistance zone than the stock is capable of showing a big breakout.
- Wait for the volumes to go up.
- The stock is forming a rounding bottom pattern.
Targets: 590