Trade ideas

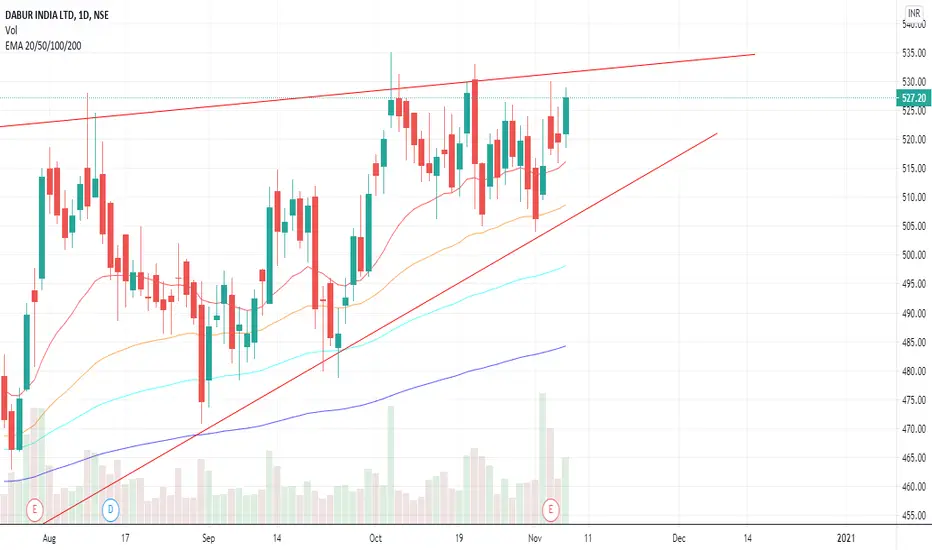
Dabur - Technical BuyBullish Wolfe Wave Formation on Daily Charts - Numbered (1-2-3-4-5)
Target Rs 552
Stop Loss 509.25


DABUR - triangle pattern & stock at important levelsstock is at important levels and triangular pattern formation. Stock hitting at important resistance levels
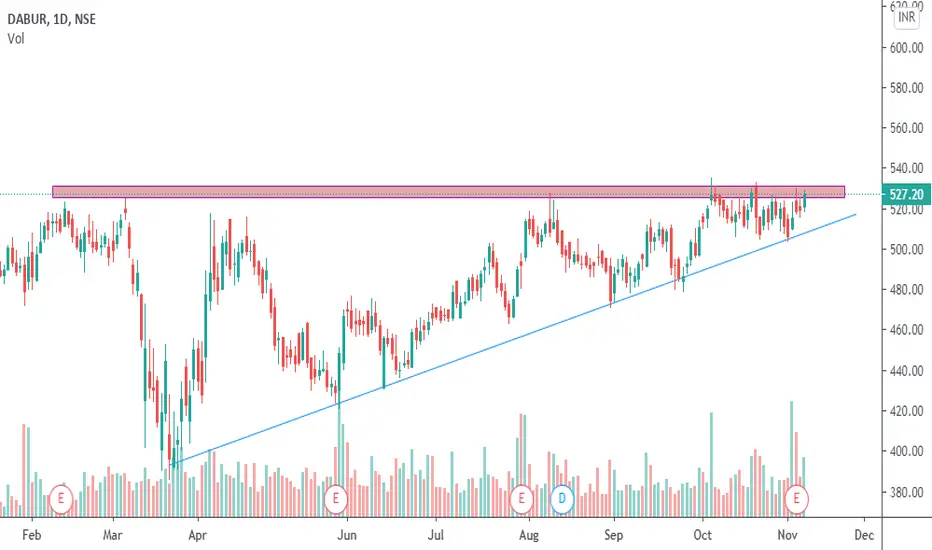

Dabur- Short term viewWith good volume growth reported QoQ in Q2 results, Dabur can be a considerate stock for next week before Diwali. Any upmove or closing above 531-532 would set target upto 540-550 + with SL 516.
Multibegger long term investment stockTrading above support area, grabb from here for long term investment
FMCG stock


Whatching and understanding all type charts.I am carefully watching and understanding charts of market company s.

DABURDabur :- 535/540 above target 560/70++ sl 505 dcb
#Disclaimer:-I just shared view for only educational purpose.


DABURprice is at huge consolidation since last month .anytime we can expect a big move..keep looking

DABUR NEAR ALL TIME HIGH BREAKOUT Dabur daily chart trading near an all-time high & making triangle pattern stock is consolidating near all-time high usually after consolidation sharp move happen
the stock also making higher low it's a bullish sing, strong buyers, available
Trading + Investment plan = You can accumulate stock between 525 to 505 levels
Breakout Above: 530
After the breakout good move expected because the stock is trying to break its all-time high
Always respect risk never take more than 1% risk on total capital for signal trade

NSE:DABUR
DISCLAIMER : . I am not a SEBI Registered analyst.
All chart analysis I publish are educational and information purposes only


Sell on rise One can sell on rise with stop as mentioned , and book at or near target with trailing stop method

DABUR H&S PATTERNHEAD & SHOULDER PATTERN FORMATION
FALL ON CARDS
disclaimer - for study purpose only

Dabur Next target 550 in one session on monthly close basis
stoploss 475 MCB
good risk to reward ration for long term
for my self study purpose not for trading


Dabur - Trading near highest long term resistance. Buy on dips Buy near 505. If drops below 505, buy near 490 which is a strong support.
Near term strategy should be Buy on dips.
Long term strategy is hold for 5 to 10 years for multifold returns.


DABUR under significant pressure#Dabur rose quite a bit on 19th & 20th Oct.
Between 21st & 22nd it has not only given up all the gains but looks under a lot of pressure and may soon crack if it falls below 508 and spends some time there..
If that happens we may see fall by another 10 to 15 points.
#Stocks #StockMarket #Intraday #TRADINGTIPS #BULLISH #Watchlist #stockstowatch #DayTrading #NSE #Nifty50 #NiftyBank
