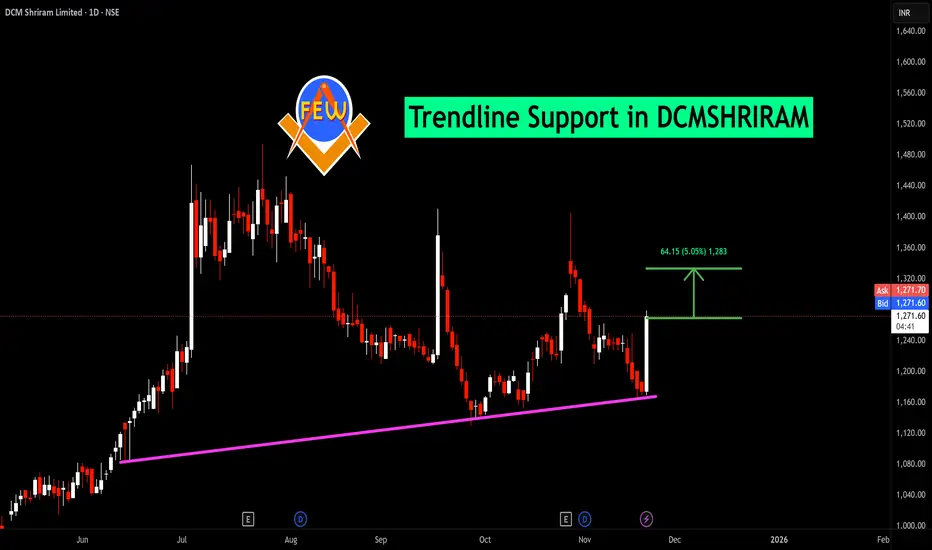
DCM Shriram Approaches Long-Term Support – Reaction Zone AheadDCM Shriram continues to trade within a well-defined long-term rising channel, respecting higher highs and higher lows over time. Each major rally has been followed by a healthy pullback toward the lower trendline, where buyers have consistently stepped in to defend the trend.
The current move is a
DCM Shriram Limited
No trades
42.55 INR
6.04 B INR
120.42 B INR
37.21 M
About DCM Shriram Limited
Sector
Industry
Website
Headquarters
New Delhi
Founded
1889
IPO date
Apr 26, 1995
Identifiers
2
ISIN INE499A01024
DCM Shriram Ltd. engages in the business of agri-rural, value added, and chemical and vinyl. It operates through the following segments: Chemicals and Vinyl, Sugar and Ethanol, Fenesta Building Systems, Shriram Farm Solutions, Fertiliser, Bioseed, and Others. The Chemicals and Vinyl segment focuses on the manufacturing of poly-vinyl chloride, carbide, and chlor alkali products. The Sugar and Ethanol segment is involved in the manufacturing of sugar, ethanol, and cogeneration of power. The Fenesta Building Systems segment refers to the windows and doors. The Shriram Farm Solutions segment deals with the plant nutrients, seeds, and pesticides. The Fertiliser segment represents the manufacturing of urea. The Bioseed segment includes the production of hybrid seeds. The Others segment consists of cement, rural retail, and plaster of paris. The company was founded by Lala Shri Ram in 1889 and is headquartered in New Delhi, India.
Related stocks

BUY TODAY SELL TOMORROW for 5%DON’T HAVE TIME TO MANAGE YOUR TRADES?
- Take BTST trades at 3:25 pm every day
- Try to exit by taking 4-7% profit of each trade
- SL can also be maintained as closing below the low of the breakout candle
Now, why do I prefer BTST over swing trades? The primary reason is that I have observed that
DCM Shriram - Continuation PatternA Continuation pattern is being formed. It may take some time to breakout, but it looks certain that when the breakout happens it could fly.
Strong ability to service debt as the company has a low Debt to EBITDA ratio of 0.09 times
The company has declared positive results in Dec'2024 after 3 con

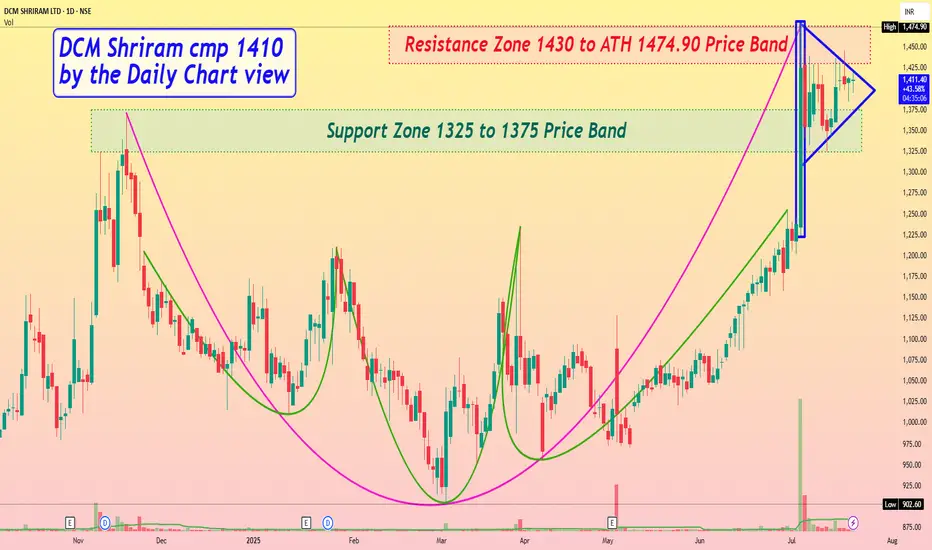
DCM Shriram cmp 1410 by the Daily Chart viewDCM Shriram cmp 1410 by the Daily Chart view
- Support Zone 1325 to 1375 Price Band
- Resistance Zone 1430 to ATH 1474.90 Price Band
- Support Zone been tested retested good and stock now consolidating
- *Bullish Pole and Flag pattern made around Support Zone and Resistance Zone*
- Volumes are fl
DCMSHRIRAM for 35% (approx..) Potential GainDCM SHRIRAM is showing Darvas box breakout with decent amount of volume..
b] All data is available in public domain..
CMP : 1300
TG : 1700
SL : 1165
TSL : Below 21 EMA
Stock's selection based on 5 Point Analysis:
1: Idea : Breakout.
2: Support : Volume, Delivery & VWAP.
3: Technical : 9/21/5

DCM Shriram End of Bottom formationDCM Shriram posted fantastic Q2FY25 YoY with 95% profit. Debtor days reduced. Reduction in equity dilution. Q1 & Q2 posted improved YoY numbers with respect to sales & profit. Operating profit improved. Expecting margins and ROCE to improve. Price is just crossed above 50 Day moving average. Technic

DCMSHRIRAM Long Base BO [Weekly]DCMSHRIRAM is showing signs of accumulations over the past 50 days and this week tried a long base BO on weekly timeframe. Considering the market conditions right now, a stock giving signs of accumulations is certainly to be taken note off.
Tracking this to see some tightness around this BO level an

Weekly breakout . Can be a silver lining at the end of a tunnelNSE:DCMSHRIRAM
Time Frame :- Weekly
Study :-
Tested Twice in past .
Was in consolidation for long time(june 2021- November 2024).
Conclusion :-
₹1251 was a strong resistance. Breakout check ✅️
Time Frame:- Daily
Study :-
Was obeying Trendline
Tested trend line twice

WEEKLY BREAKOUT IN SHRIRAMWeekly breakout seen in Shriram. The stock has given out break out from a triangle pattern.

DCM Shriram rounding base patternDCM Shriram has formed a rounding base pattern
If stock breaks resistance it will move upside.
Pattern base target plotted.
Disclaimer :
Chart shared here is for education purpose only, no any buy and sell recommendation given on stock.

See all ideas
Summarizing what the indicators are suggesting.
Oscillators
Neutral
SellBuy
Strong sellStrong buy
Strong sellSellNeutralBuyStrong buy
Oscillators
Neutral
SellBuy
Strong sellStrong buy
Strong sellSellNeutralBuyStrong buy
Summary
Neutral
SellBuy
Strong sellStrong buy
Strong sellSellNeutralBuyStrong buy
Summary
Neutral
SellBuy
Strong sellStrong buy
Strong sellSellNeutralBuyStrong buy
Summary
Neutral
SellBuy
Strong sellStrong buy
Strong sellSellNeutralBuyStrong buy
Moving Averages
Neutral
SellBuy
Strong sellStrong buy
Strong sellSellNeutralBuyStrong buy
Moving Averages
Neutral
SellBuy
Strong sellStrong buy
Strong sellSellNeutralBuyStrong buy
Displays a symbol's price movements over previous years to identify recurring trends.
MOSMALL250
Motilal Oswal Nifty Smallcap 250 ETF Units Exchange Traded FundWeight
0.25%
Market value
39.75 K
USD
Explore more ETFs
Frequently Asked Questions
The current price of DCMSHRIRAM is 1,114.40 INR — it has decreased by −1.61% in the past 24 hours. Watch DCM Shriram Limited stock price performance more closely on the chart.
Depending on the exchange, the stock ticker may vary. For instance, on NSE exchange DCM Shriram Limited stocks are traded under the ticker DCMSHRIRAM.
DCMSHRIRAM stock has fallen by −3.31% compared to the previous week, the month change is a −4.81% fall, over the last year DCM Shriram Limited has showed a 5.93% increase.
DCMSHRIRAM reached its all-time high on Jul 24, 2025 with the price of 1,502.30 INR, and its all-time low was 73.55 INR and was reached on Mar 13, 2014. View more price dynamics on DCMSHRIRAM chart.
See other stocks reaching their highest and lowest prices.
See other stocks reaching their highest and lowest prices.
DCMSHRIRAM stock is 2.41% volatile and has beta coefficient of 1.23. Track DCM Shriram Limited stock price on the chart and check out the list of the most volatile stocks — is DCM Shriram Limited there?
Today DCM Shriram Limited has the market capitalization of 173.66 B, it has decreased by −0.61% over the last week.
Yes, you can track DCM Shriram Limited financials in yearly and quarterly reports right on TradingView.
DCMSHRIRAM net income for the last quarter is 2.12 B INR, while the quarter before that showed 1.58 B INR of net income which accounts for 34.21% change. Track more DCM Shriram Limited financial stats to get the full picture.
DCM Shriram Limited dividend yield was 0.84% in 2024, and payout ratio reached 23.23%. The year before the numbers were 0.77% and 23.02% correspondingly. See high-dividend stocks and find more opportunities for your portfolio.
As of Feb 15, 2026, the company has 15.45 K employees. See our rating of the largest employees — is DCM Shriram Limited on this list?
EBITDA measures a company's operating performance, its growth signifies an improvement in the efficiency of a company. DCM Shriram Limited EBITDA is 15.49 B INR, and current EBITDA margin is 11.11%. See more stats in DCM Shriram Limited financial statements.
Like other stocks, DCMSHRIRAM shares are traded on stock exchanges, e.g. Nasdaq, Nyse, Euronext, and the easiest way to buy them is through an online stock broker. To do this, you need to open an account and follow a broker's procedures, then start trading. You can trade DCM Shriram Limited stock right from TradingView charts — choose your broker and connect to your account.
Investing in stocks requires a comprehensive research: you should carefully study all the available data, e.g. company's financials, related news, and its technical analysis. So DCM Shriram Limited technincal analysis shows the strong sell today, and its 1 week rating is sell. Since market conditions are prone to changes, it's worth looking a bit further into the future — according to the 1 month rating DCM Shriram Limited stock shows the neutral signal. See more of DCM Shriram Limited technicals for a more comprehensive analysis.
If you're still not sure, try looking for inspiration in our curated watchlists.
If you're still not sure, try looking for inspiration in our curated watchlists.