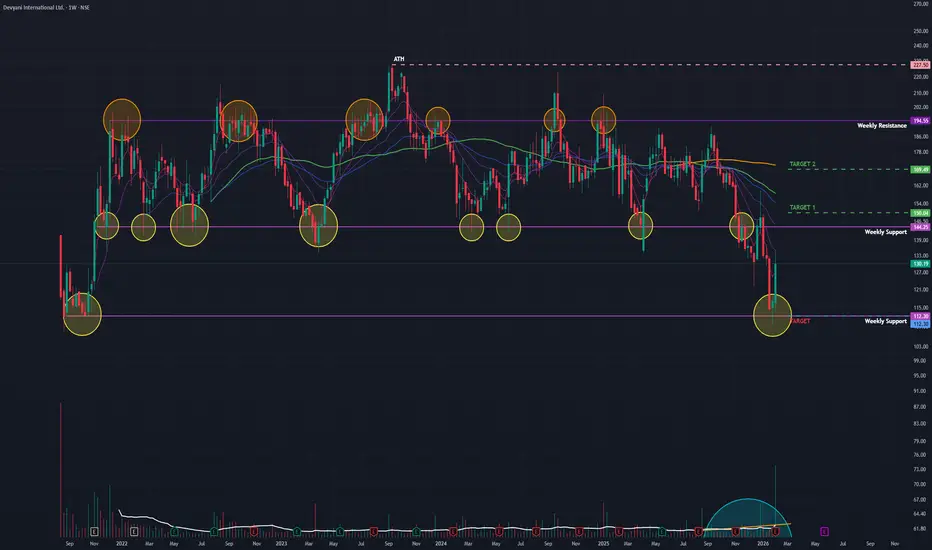
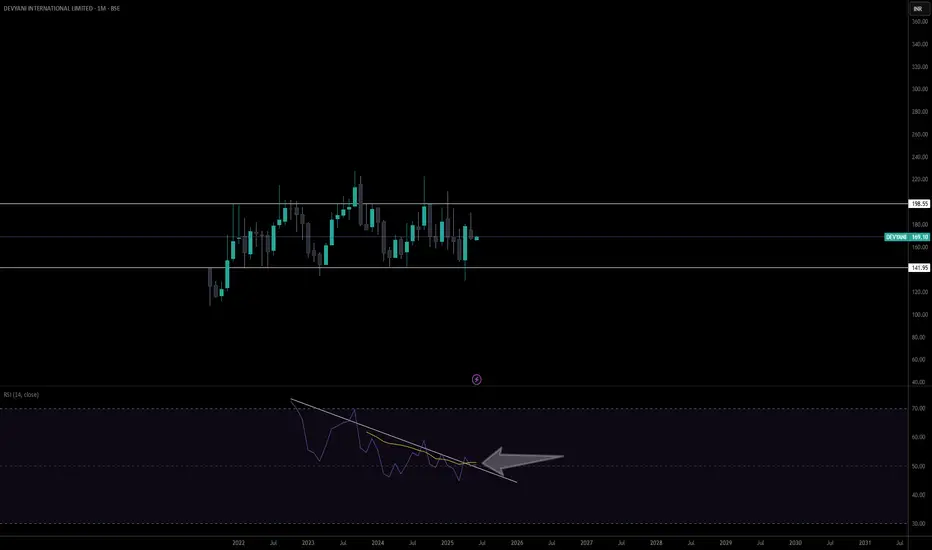
Devyani Int (W): Aggressive Bullish, Turnaround at Major Support(Timeframe: Weekly | Scale: Logarithmic)
The stock has confirmed a major "V-Shape Reversal" from its long-term support zone of ₹110. The surge is backed by "Climax Volume" and a positive reception to its Q3 operational updates, signaling that the 2-year correction might be over.
🚀 1. The Fund
Devyani International Ltd.
No trades
Next report date
—
Report period
—
EPS estimate
—
Revenue estimate
—
−0.35 INR
91.49 M INR
49.38 B INR
440.91 M
About Devyani International Ltd.
Sector
Industry
CEO
Virag Joshi
Website
Headquarters
Gurugram
Founded
1991
IPO date
Aug 16, 2021
Identifiers
2
ISIN INE872J01023
Devyani International Ltd. engages in the development and operation of quick service restaurants. It operates through the following geographical segments: India, Thailand and Nepal. The company was founded on December 13, 1991 and is headquartered in Gurugram, India.
Related stocks
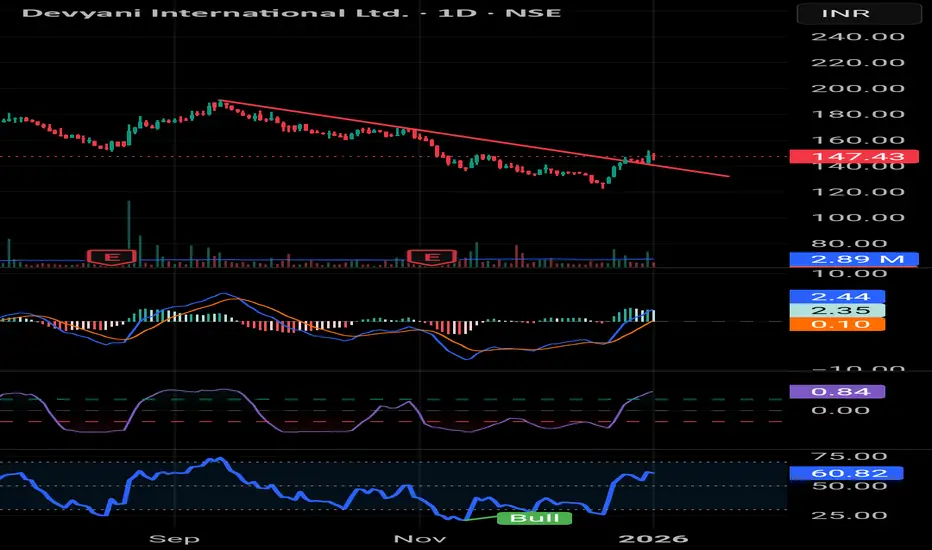
Devyani with merge catalyst at the verge of potential reversalDevyani International (DEVYANI) at ₹145-147 shows potential reversal signals.
Bearish trend persists (price below SMAs, MACD histogram negative at -2.9), but RSI ~60 hints at momentum shift from oversold (prior lows ~50), Stochastic dipping into bullish territory, and RSI divergence emerging—classi
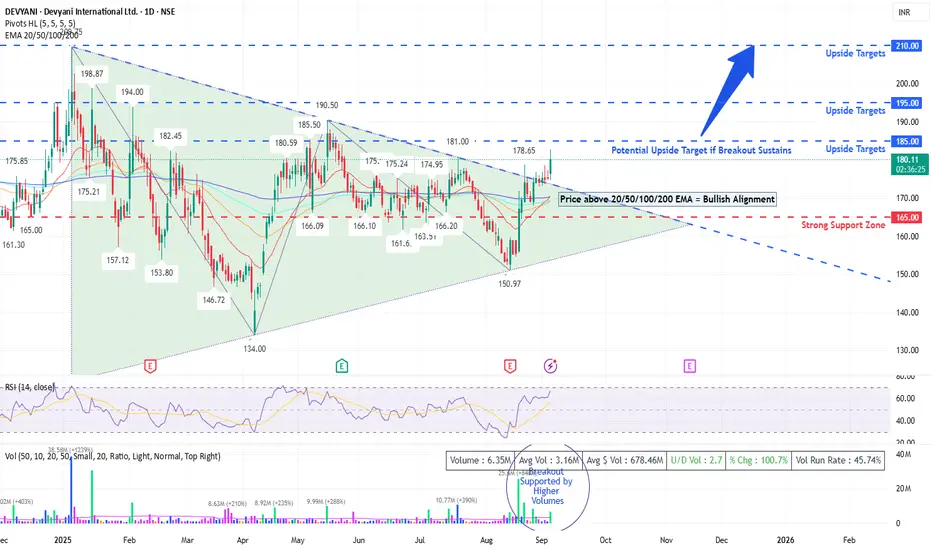
DEVYANI - TRINGLE BREAKOUTDevyani Intl – Triangle Breakout Loading? 🚀
📊 Stock Analysis: Devyani International Ltd (NSE: DEYANI)
🔹 Technical Overview
Pattern: Symmetrical Triangle breakout attempt visible on daily charts. Price has tested the upper resistance trendline multiple times (₹190–₹195 zone) and is now trading
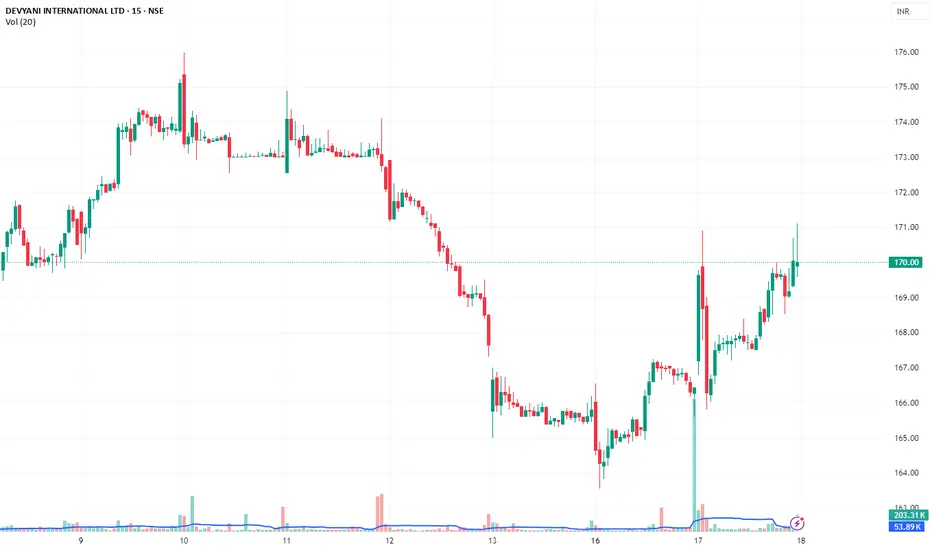
DEVYANI – Breakout Retest Completed | Short-Term Rally BrewingDEVYANI – Breakout Retest Completed | Short-Term Rally Brewing
🟢 CMP: ₹170.15
📆 Date: 17 June 2025
📊 Timeframe: 2–4 Days Swing Trade
🔍 Technical Analysis
✅ DEVYANI broke above the key level of ₹169.20 with conviction
✅ Post breakout, the stock consolidated in a tight range – a classic bullish cont
Devyani looking Bullish from herePrice has been in sideways since the begining. Monthly RSI broke out and re-testing, looks like it's time to come out of the range. Bullish for June. Not a Financial Advise.
devyani international ltd.Let's conduct a **technical analysis** of **Devyani International Ltd.** (Devyani), which is one of the largest franchisees of Yum! Brands in India, operating popular brands like Pizza Hut, KFC, and Taco Bell.
---
### **Technical Analysis of Devyani International Ltd.**
#### **1. Support and Resi

Momemtum Trade in Devyani InternationalA Short Momentum Trade in Devayani International is active now.
On 2hr TF it has given break out of C&H pattern and trade details can be found in Chart.

Bullish idea on Devyani The stock is consolidating in a range for almost 3 years. and now trying to break the range. If this happens, the first target will be 223 and second target will be 264.

Devyani - The time is changing."Hi everyone, VCP Trader is back with an exciting investment opportunity!
Stock in Focus: Devyani International
This stock has been forming a strong base for over 3 years, creating a range of 100 points. Such prolonged consolidations often lead to explosive moves, and this setup looks like a textbo

DEVYANI#DEVYANI
Observations:
Forming Higher Highs (HH) and Higher Lows (HL) on the weekly chart, indicating a potential uptrend.
Last week's big move was accompanied by above-average volume, suggesting strong buying interest.
Relative strength against Nifty has improved.
Caution:
The stock has

See all ideas
Summarizing what the indicators are suggesting.
Neutral
SellBuy
Strong sellStrong buy
Strong sellSellNeutralBuyStrong buy
Neutral
SellBuy
Strong sellStrong buy
Strong sellSellNeutralBuyStrong buy
Neutral
SellBuy
Strong sellStrong buy
Strong sellSellNeutralBuyStrong buy
An aggregate view of professional's ratings.
Neutral
SellBuy
Strong sellStrong buy
Strong sellSellNeutralBuyStrong buy
Neutral
SellBuy
Strong sellStrong buy
Strong sellSellNeutralBuyStrong buy
Neutral
SellBuy
Strong sellStrong buy
Strong sellSellNeutralBuyStrong buy
Displays a symbol's price movements over previous years to identify recurring trends.
MOSMALL250
Motilal Oswal Nifty Smallcap 250 ETF Units Exchange Traded FundWeight
0.30%
Market value
47.47 K
USD
HESC
HSBC ETFs PLC - HSBC MSCI Emerging Markets Small Cap Screened UCITS ETFWeight
0.03%
Market value
14.07 K
USD
Explore more ETFs
Frequently Asked Questions
The current price of DEVYANI is 132.02 INR — it has decreased by −1.20% in the past 24 hours. Watch Devyani International Ltd. stock price performance more closely on the chart.
Depending on the exchange, the stock ticker may vary. For instance, on NSE exchange Devyani International Ltd. stocks are traded under the ticker DEVYANI.
DEVYANI stock has risen by 5.74% compared to the previous week, the month change is a −1.36% fall, over the last year Devyani International Ltd. has showed a −19.99% decrease.
We've gathered analysts' opinions on Devyani International Ltd. future price: according to them, DEVYANI price has a max estimate of 192.00 INR and a min estimate of 132.00 INR. Watch DEVYANI chart and read a more detailed Devyani International Ltd. stock forecast: see what analysts think of Devyani International Ltd. and suggest that you do with its stocks.
DEVYANI reached its all-time high on Sep 11, 2023 with the price of 227.50 INR, and its all-time low was 107.55 INR and was reached on Aug 23, 2021. View more price dynamics on DEVYANI chart.
See other stocks reaching their highest and lowest prices.
See other stocks reaching their highest and lowest prices.
DEVYANI stock is 2.76% volatile and has beta coefficient of 1.68. Track Devyani International Ltd. stock price on the chart and check out the list of the most volatile stocks — is Devyani International Ltd. there?
Today Devyani International Ltd. has the market capitalization of 165.08 B, it has increased by 13.51% over the last week.
Yes, you can track Devyani International Ltd. financials in yearly and quarterly reports right on TradingView.
Devyani International Ltd. is going to release the next earnings report on May 30, 2026. Keep track of upcoming events with our Earnings Calendar.
DEVYANI earnings for the last quarter are −0.08 INR per share, whereas the estimation was −0.01 INR resulting in a −700.00% surprise. The estimated earnings for the next quarter are −0.19 INR per share. See more details about Devyani International Ltd. earnings.
Devyani International Ltd. revenue for the last quarter amounts to 14.41 B INR, despite the estimated figure of 14.56 B INR. In the next quarter, revenue is expected to reach 13.98 B INR.
DEVYANI net income for the last quarter is −103.89 M INR, while the quarter before that showed −218.87 M INR of net income which accounts for 52.53% change. Track more Devyani International Ltd. financial stats to get the full picture.
No, DEVYANI doesn't pay any dividends to its shareholders. But don't worry, we've prepared a list of high-dividend stocks for you.
As of Feb 13, 2026, the company has 20.42 K employees. See our rating of the largest employees — is Devyani International Ltd. on this list?
EBITDA measures a company's operating performance, its growth signifies an improvement in the efficiency of a company. Devyani International Ltd. EBITDA is 8.27 B INR, and current EBITDA margin is 16.96%. See more stats in Devyani International Ltd. financial statements.
Like other stocks, DEVYANI shares are traded on stock exchanges, e.g. Nasdaq, Nyse, Euronext, and the easiest way to buy them is through an online stock broker. To do this, you need to open an account and follow a broker's procedures, then start trading. You can trade Devyani International Ltd. stock right from TradingView charts — choose your broker and connect to your account.
Investing in stocks requires a comprehensive research: you should carefully study all the available data, e.g. company's financials, related news, and its technical analysis. So Devyani International Ltd. technincal analysis shows the neutral today, and its 1 week rating is sell. Since market conditions are prone to changes, it's worth looking a bit further into the future — according to the 1 month rating Devyani International Ltd. stock shows the sell signal. See more of Devyani International Ltd. technicals for a more comprehensive analysis.
If you're still not sure, try looking for inspiration in our curated watchlists.
If you're still not sure, try looking for inspiration in our curated watchlists.