DIVIS LAB DIVIS lab is on verge of a very very big breakout which could drive it in open sky everybody should consider it for long
Trade ideas
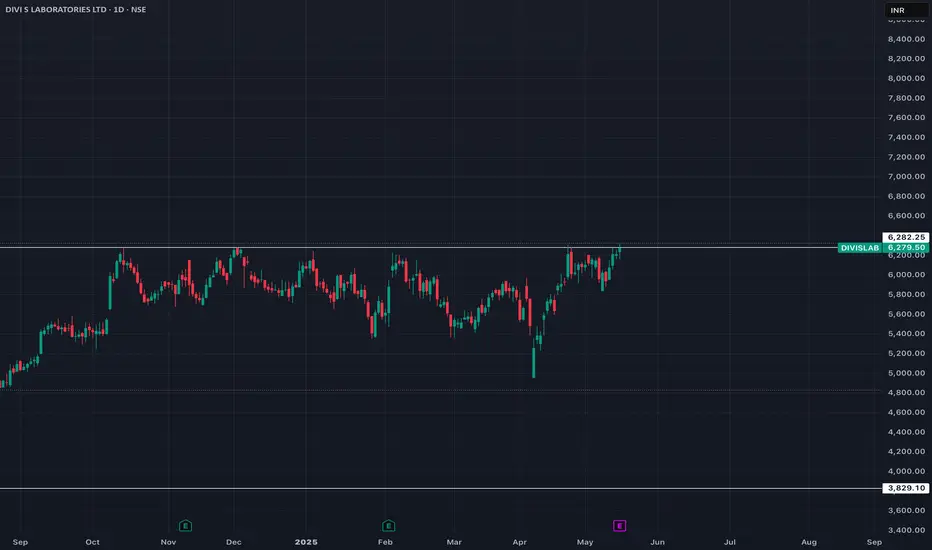
Next 6 Months seems GreenDivis Chart shows some upcoming greens in next 6 months?? 7000 very soon.. ill hold for next 6 months.. 20% is not going anywhere
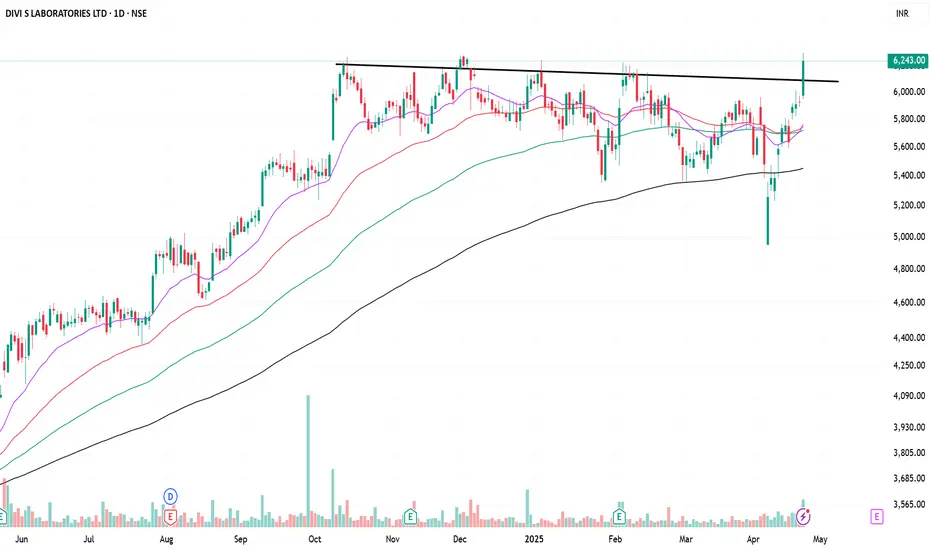
Divis BreakoutAfter a long consolidation Divis Labs has given a breakout and the best thing is that the sector is also in momentum. NSE:DIVISLAB is a very strong stock in its sector and one can look at this share not only for short term but for medium to long term as well. Follow the line as stop loss or the level around 6300 (once that has been crossed). Strong stock and good momentum.
divis lab conditional buydivis lab has recently increased its production of certain items in pipeline
today is expiry but pharma seems safe today
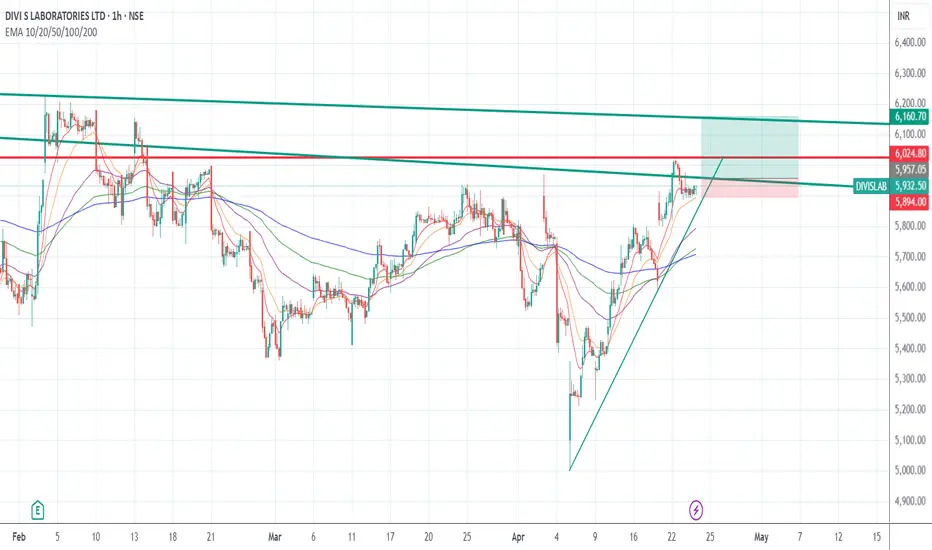
condition is it should hold one candle in 30 minutes above 5950, than breakout will happen
then targets will be 6020-6080-6150
call is for intra day sl will be 5890
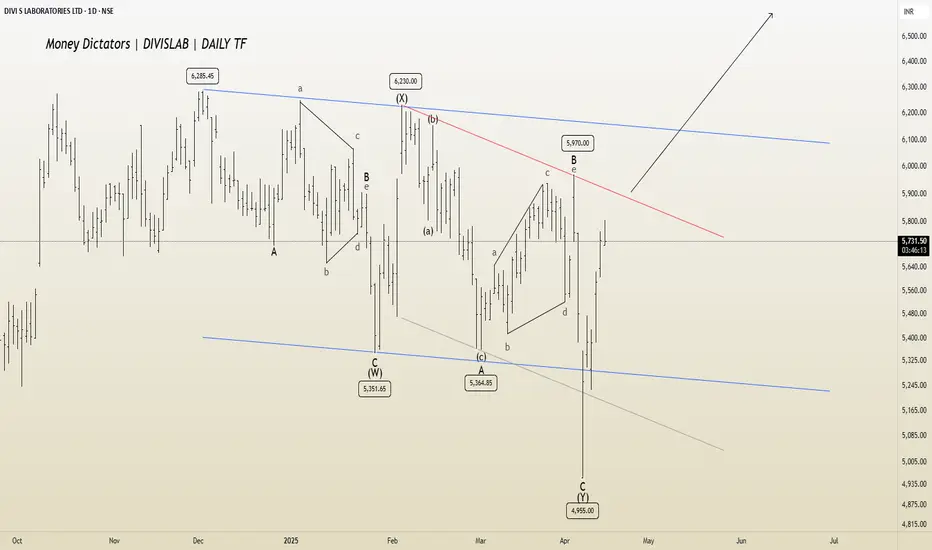
DIVISLAB: Eyeing Breakout from A-B-C Channel Daily TF
DIVISLAB is nearing the completion of a complex W-X-Y corrective pattern. A long position could be considered after a breakout from the A-B-C channel, with potential targets in the 6100–6400 range.
I will update more information soon.
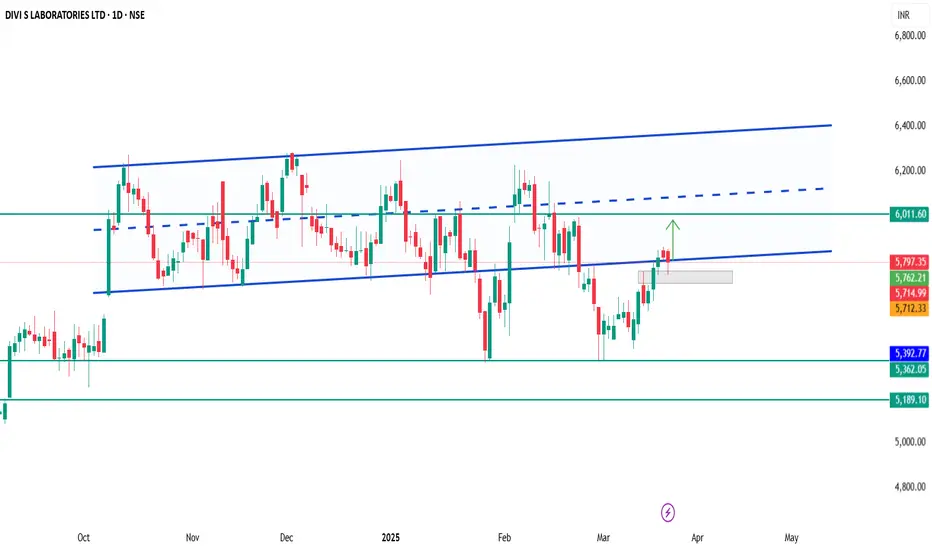
view on DivislabDivislab should cross resistance of 5860 to resume upside target of 6010-6060. if fails to do so and trades below 5710 then downside target would be 5600-5560
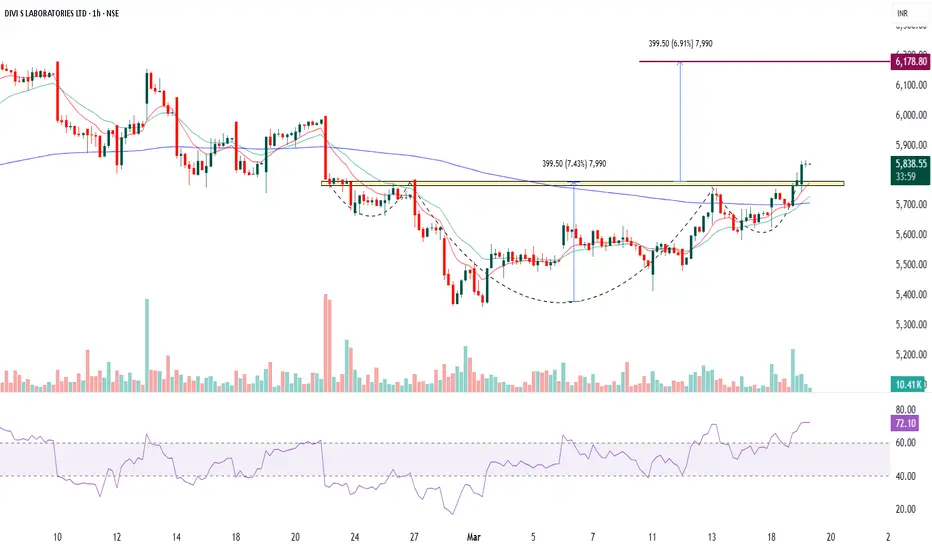
DIVISLAB - Inverted Head and Shoulder's Pattern - LONGThis is a 1-hour chart of DIVI'S LABORATORIES LTD showing an inverted head and shoulders pattern with the following key observations:
1. Pattern Details:
The neckline is around 5830.
The breakout has already happened with good volume, confirming the pattern.
2. EMA Analysis:
10 EMA and 20 EMA are sloping upwards, indicating bullish momentum.
200 EMA is still above the price, suggesting that the broader trend is yet to confirm a full reversal.
3. RSI Analysis:
RSI is at 72.21, which is above 60, indicating strong bullish momentum but nearing the overbought zone.
4. Trade Setup:
Entry: Ideal entry was around the neckline breakout at 5830–5840. However, a retest of the neckline (if it happens) could offer another entry point.
Stop Loss (SL): Below the right shoulder low at around 5650.
Target: Measured move based on the depth of the inverted head is approximately 399.50 points, giving a target around 6178.
Summary:
Entry: 5830–5840 (on breakout or retest)
Stop Loss: 5650
Target: 6178
Risk-to-Reward Ratio: Approximately 2:1
This analysis is for educational purposes only and should not be considered as financial advice. Trading and investing in financial markets involve significant risk, and past performance is not indicative of future results. You should conduct your own research and consult with a qualified financial advisor before making any trading or investment decisions. The author is not responsible for any financial losses or damages that may result from the use of this information.
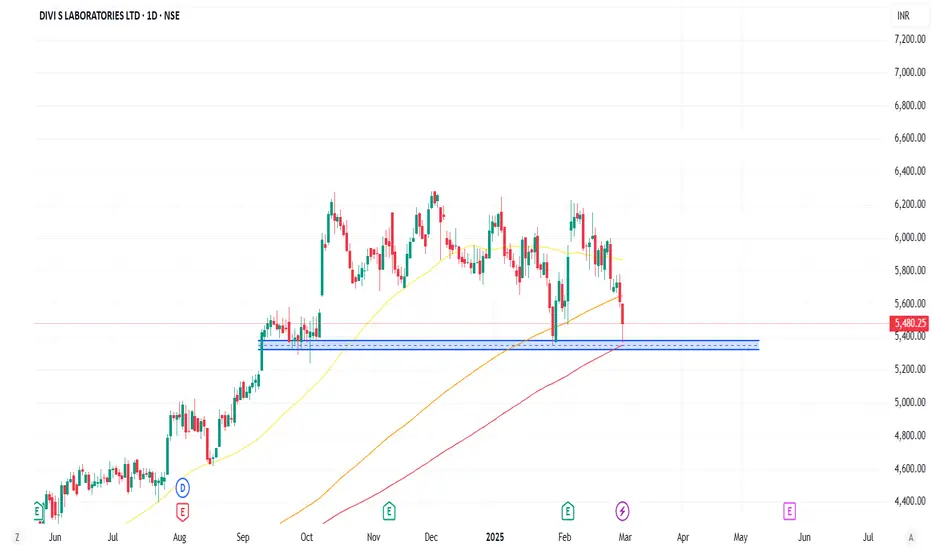
DIVISLABThe chart is self-explanatory and is shared for educational purposes.
DIVISLAB's stock has approached a strong support level and is expected to reverse from this support. Wait for confirmation before entering. If the support level breaks, strong confirmation is needed for entry. Trade with a stop loss.
DIVISLAB Price action alaysisBased on the recent price action analysis of DIVISLAB (Divi's Laboratories Ltd.), the stock is showing mixed signals with a slight bearish bias in the short term:
1. The stock price has experienced a recent drop, closing at 5843.75, which is a 2.77% decrease from the previous price of 6010.5.
2. Short-term technical indicators suggest a mildly bearish outlook:
- The stock is trading below its 5-day and 12-day Simple Moving Averages (SMA).
- The Parabolic SAR indicates a mild bearish trend at 6230.
- The Aroon Indicator is at 7.14, suggesting a potential weakening of the current trend.
3. However, some bullish signals are present:
- The MACD shows a bullish crossover and is sustaining above the signal line.
- The stock is trading above its 20-day, 50-day, and 100-day SMAs, indicating a generally positive medium-term trend.
4. Volume analysis shows that the latest trading volume (294K) is lower than the 5-period average volume (396K), which might indicate decreasing selling pressure .
5. The stock is currently trading in the upper range of its Bollinger Bands, with the upper band at 6260 and the lower band at 5465.
6. Option chain analysis reveals a Put-Call Ratio (PCR) of 0.33 for the most recent date, suggesting more put options are being traded compared to call options, which can be interpreted as a bearish sentiment.
7. The stock has shown positive returns in the short term but negative returns over a longer period.
In conclusion, while DIVISLAB is experiencing some short-term bearish pressure, it maintains a relatively strong position above key moving averages. Traders and investors should closely monitor the stock for potential trend reversals and consider the mixed signals in their decision-making process.

Divi's Laboratories - Stable PerformerTopic Statement:
Divi's Laboratories has shown resilience amidst the broad market correction, with stable price movements and potential for accumulation near the 180-day moving average.
Key points:
1. Company reported a profit growth of 64% QoQ for the third quarter.
2. Price broke down from the up-trending channel, transitioning into a sideways pattern.
3. Strong resistance is present at the 6000 level.
4. The stock repeatedly approaches the 180-day moving average, presenting a good buying opportunity.

Signature of wave iv by RSIRSI level at wave iv should be less than that of wave ii . If it does not happen , then we can look for wave extension . Catch is wave iv should be higher than wave ii . But if RSI is lower than that of wave ii , this is a positive divergence signaling a higher top . Just observe . Enjoy the market

Alteration between wave(ii) and (iv) is a law of the markets Wave (iii) is exactly 2.618 of wave (i) taken from the end of wave (ii) . Wave (ii) is a flat correction . So wave iv cannot be a flat correction , as per the law of alternation , which basically means wave ii and wave iv cannot be similar. Dissimilarity can occur by price correction and by time correction . I think we will get a time correction here , if not price correction . Basically saying , avoid . If it explodes next week it will just be wave v . Always wave iv has to balance wave iv either by time of price. Regards

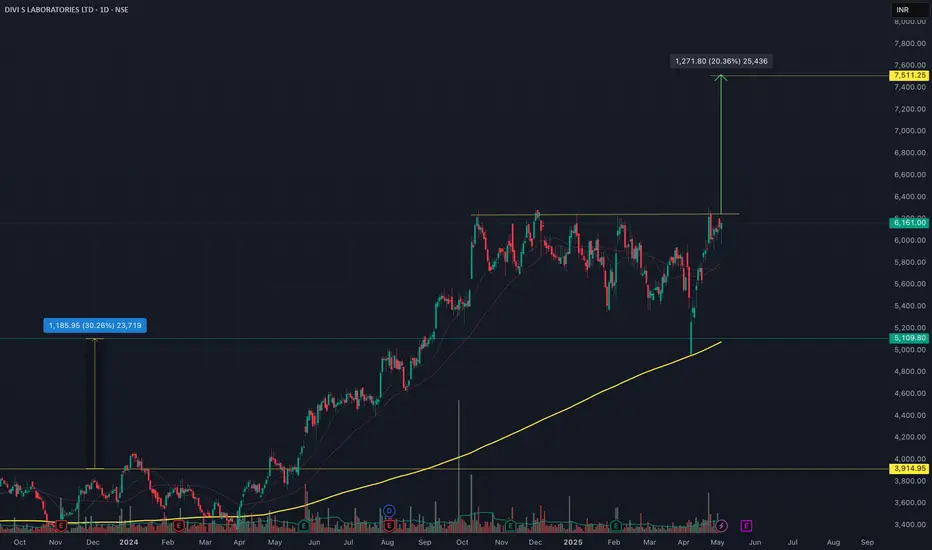
DIVISLAB Flag and Pole FormationTrade Setup
Entry Level: ₹6,336 🚀
Stop Loss (SL): ₹5,323 (Closing Basis)
SL Percentage: -16.01% 📉
Target Levels:
T1 (Positional Target): ₹7,404 (+16.88%) 🎯
Risk-to-Reward (R:R): 1:1⚖️
Technical Highlights
📌 Flag & Pole: The stock shows a strong flag and pole pattern, indicating bullish potential.
📌 Key DMAs: Trading comfortably above key moving averages (DMAs), adding strength to the setup.
📌 Pullback Bounce: Well-supported bounce after pullbacks.
📌 Volume: Needs improvement for stronger confirmation.
📌 RSI: Decent, supportive of the setup.
Key Strategy
⚡ Wait for Volume Confirmation: Entry should be accompanied by increasing volumes to ensure breakout sustainability.
⚡ Tight Monitoring: Since the R:R is moderate, ensure disciplined adherence to the SL.
⚡ Partial Booking at ₹7,000: Optional for risk reduction before T1.
Risks:
1️⃣ Volume Concern: Weak volume might fail to sustain breakout.
2️⃣ Broader Market Trends: Adverse market movements may impact performance despite strong technicals.
💬 Execute cautiously, and ensure disciplined trading!
⚠ Disclaimer: This is for educational purposes and not financial advice. Please consult your advisor before trading.

4th feb divis lab for intrahello everyone
divis lab has shown meaningful breakout
as per prevolume it should go up
buy in zone 6000-6030
with stop lass at 5880
target will be 6150-6200++

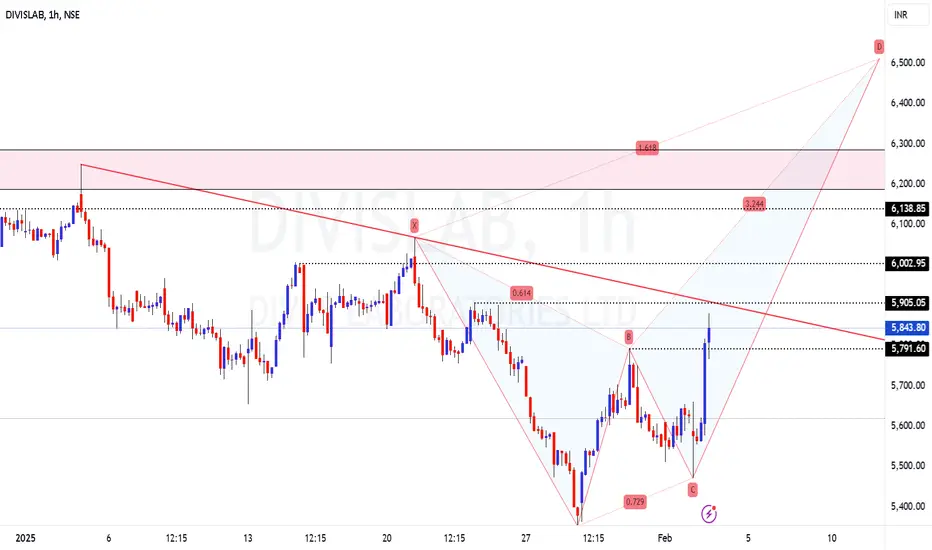
Bearish Crab on DIVISLABThe harmonic levels are derived based on fib levels. price action wise, resistance and support are marked.. price is back inside the range..
200 period EMA on hourly needs to be taken out decisively for further momentum/upmove.
I am not a SEBI registered Analyst. Views are personal and for educational purpose only. Please consult your Financial Advisor for any investment decisions. Please consider my views only to get a different perspective (FOR or AGAINST your views). Please don't trade FNO based on my views. If you like my analysis and learnt something from it, please give a BOOST. Feel free to express your thoughts and questions in the comments section.
Breakdown Divi's labExpecting a breakdown in Divi's lab, the PE is right now 82.
Nifty Pharma chart also looks slightly weak. If Nifty falls down this can be a good contributer.

Divis Labs - Good Export DataThe co had good export data + the rupee is helping.
Expect a wedge breakout above 6000 with a Stoploss 5680.

Good place to enter in this stage.Monthly 60RSI weekly. above 60 rsi. and daily support. daily supporting 40RSI. according to These parameters I hope. this is stock will. now go further down. and volume also support. Buy and sell ratio also support the share. to go. up keep I on this share.

Potential breakout in DivislabNSE:DIVISLAB A strong bullish ATH breakout is about to be formed @6200-6250 with the potential to reach 6700-6800 in a few months. With a good R: R of 1.69 one can trade accordingly.
The next big support is @ 5700 followed by 5500

divislab weak at topi found multiple setups
1. double top at the higher level
2. trendline breakdown move
have urge to fil the gap ,
recent suppport is 5780 , if this is broken then it will be confirmed down move

TradingBoth index futures and stock F&Os can be easily understood by tracking Open Interest. Simply put, when Open Interest increases, it means more money is moving into the futures contract, and when open interest drops, it means money is moving out of the contract.
The 90/10 strategy, popularized by Warren Buffett, allocates 90% of your portfolio to a low-cost S&P 500 index fund and 10% to short-term government bonds. This aims for long-term growth through stocks while offering stability with bonds.21 May 2024

Divi's Lab: Potential Upswing as VCP Pattern Nears Breakout withStock: Divi's Laboratories Ltd. (DIVISLAB)
Analysis:
Divi's Lab recently experienced a breakout with strong volume, signaling solid buying interest. Since then, the stock has seen some corrective movement, presenting a potential opportunity. The current pattern resembles a Volatility Contraction Pattern (VCP), where price consolidates in narrowing ranges, often a setup for a continuation in the direction of the previous breakout.
If this contraction phase concludes with another breakout on increased volume, it could indicate a fresh upswing and a strong bullish trend resumption.
Technical Setup:
Pattern: Volatility Contraction Pattern (VCP)
Key Signal: Volume spike during breakout
Expected Move: Upside continuation if breakout confirms with volume
Trade Plan:
Entry: On breakout above current resistance, ideally with a high volume candle
Target: Initial target based on previous resistance levels or recent highs
Stop Loss: Below the consolidation range

Divi's Laboratories (DIVISLAB)The daily chart of Divi's Laboratories (DIVISLAB) on NSE shows a strong uptrend, with the stock forming higher highs and higher lows while trading above key moving averages (50-day SMA at ₹5809.59, 100-day SMA at ₹5358.82, and 21-day EMA at ₹5967.32), confirming bullish momentum in both the short and medium term. The price is nearing a significant resistance zone at ₹6250-₹6300, and a breakout above this level, accompanied by strong volume, could trigger further upside. The RSI at 66.98 suggests the stock is approaching overbought territory, warranting caution as a consolidation or minor retracement is possible. The MACD remains bullish, with the MACD line above the signal line and green histogram bars indicating positive momentum. Immediate support levels lie at ₹5967 and ₹5809, providing a cushion in case of a pullback. Overall, the stock is well-positioned, but traders should watch for a breakout or signs of reversal near resistance.
