Dixon - Resistance zone at 17400-17600CMP: 17200
TF: Daily
Dixon had a one way waterfall slide from 18500 to 16000
Now the price retraced to about 50%.. The 0.618 fib and the volume cluster is placed at around the 17500 mark
The previous fall on JAN 2025 was also from this zone of 17500 (See below)
I am not confident/optimistic about a V shaped recovery on this counter. I understand that this script is high beta and volatile.. but, a follow through sell off is what I am looking for.
As far as the wave counts, I believe that larger degree WXY correction is in progress. and we are in the A leg of the Y wave down.
Disclaimer: I am not a SEBI registered Analyst and this is not a trading advise. Views are personal and for educational purpose only. Please consult your Financial Advisor for any investment decisions. Please consider my views only to get a different perspective (FOR or AGAINST your views). Please don't trade FNO based on my views. If you like my analysis and learnt something from it, please give a BOOST. Feel free to express your thoughts and questions in the comments section.
DIXON trade ideas

large EMS sector companieshere you can see sector is going to make a breakout i think and some stocks are already out performing this sector as compare to this sectoral index which i have created

Bullish on DIXON - Swing / PositionalDIXON Tech is in an uptrend on the Daily charts and has come into the buying zone.
Price has been forming consistent Higher Lows since April 2025 which shows that there is good buying happening at each correction.
The stock had corrected into the strong support zone by end of Sep-25 and now it has given a good price action on the Hourly chart that indicates that buyers are once again stepping in.
I have built long position in the stock for a Target of 22,800 price level which will be a new All time high for the stock.
SL is kept at 15,980. Potential returns targeted is 30% +
P.S. Not a recommendation. Pls do your own due diligence.

DIXON REACTING AT GANN LINE CROSSINGHere iwould like to show you how gann fan crossings are reacting for dixon.Look at the chart i plotted here two gann FAN symmetrical but opposite(180 DEGREE) .
Here you can see that after completion of inverse head and shoulder dixon is rallying down and penitrated neckline of H&S now trading near previous consolidation zone if it is broken, I am expecting that it will try to test T1 which is previous support and cross point of gann lines.
Cross lines are marked by RED coloured arrow. where dixon is reacting.
If you see closely there is a gap bellow previous consolidation zone,it might be possible that dixon coming down to fill this gap .
red lines are mentioned here as resistance and green as support.
this is not my buy/sell call please remember.

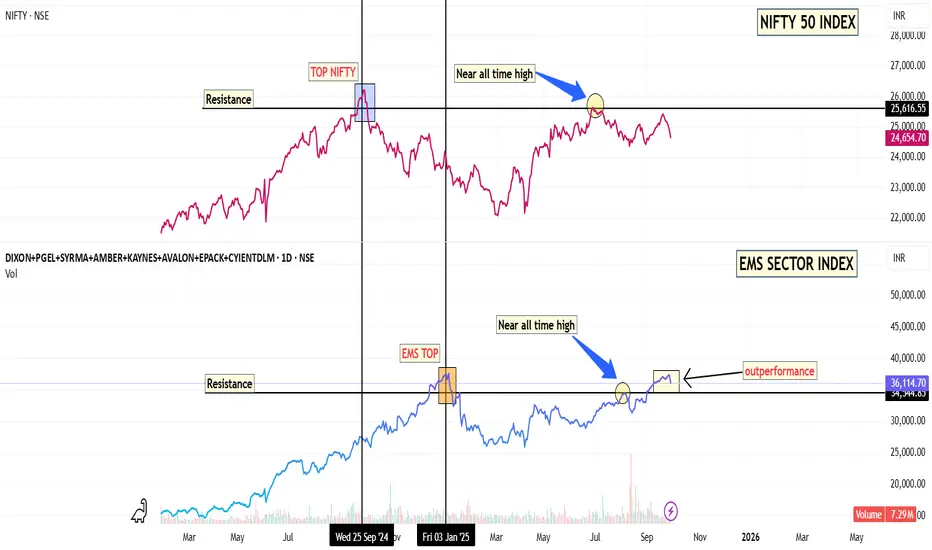
OUTPERFORMANCE OF EMS SECTRO IN INDIAHere you can see how nifty had top first and after that ems sector as you are able to see in this chart .
And now you are able to when we are compare nifty and ems index to its all NEAR time HIGH then nifty could not able to maintain its near time high but here ems sector index could able to make all time high is a clear cut sign off out performance by this sector
BUY TODAY SELL TOMORROW for 5%DON’T HAVE TIME TO MANAGE YOUR TRADES?
- Take BTST trades at 3:25 pm every day
- Try to exit by taking 4-7% profit of each trade
- SL can also be maintained as closing below the low of the breakout candle
Now, why do I prefer BTST over swing trades? The primary reason is that I have observed that 90% of the stocks give most of the movement in just 1-2 days and the rest of the time they either consolidate or fall
Cup and Handle Breakout in DIXON
BUY TODAY SELL TOMORROW for 5%

EMS ( ESDM sector is minting money )Here are the most important share of this ems sector with their share price and Kaynes , Dixon , are on a verge of breakout,
And already amber and Asmtech has started their rally so keep focus on this

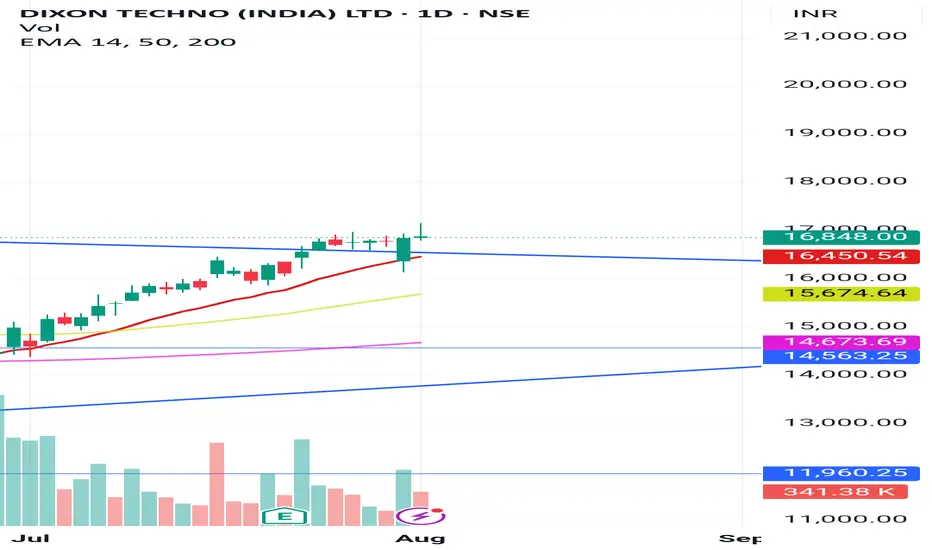
Dixon nears lifetime high after sharp recoveryTopic Statement:
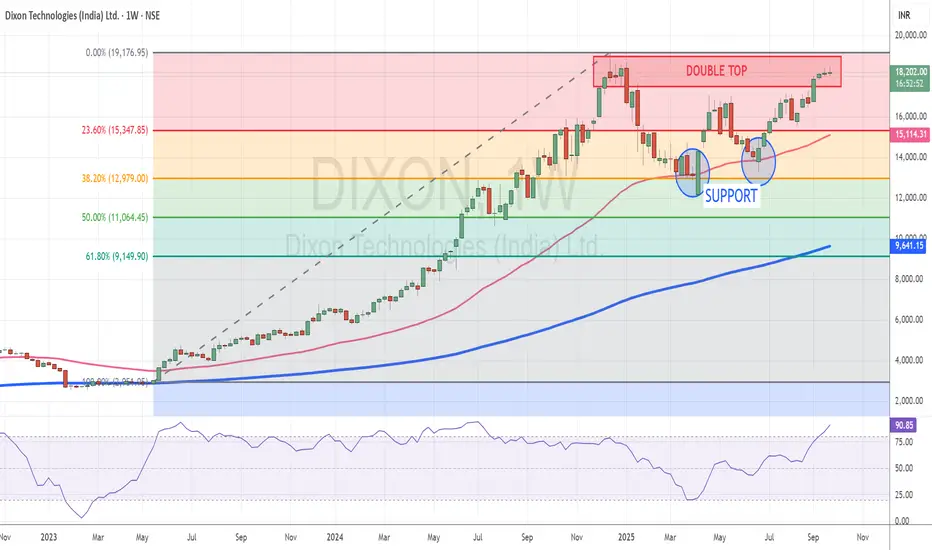
Dixon has rebounded strongly in line with the broader market rally but now approaches critical resistance levels that may cap further upside.
Key Points:
1. The stock retraced to the 38.2% Fibonacci level where it found strong support and resumed its upward move
2. The 50-day EMA acted as a deflection point, offering additional support during the recovery
3. Price is now at its lifetime high near the 18,000 mark, where a double top candlestick pattern is forming
4. The double top indicates significant resistance, making it a potential shorting opportunity unless a breakout confirms further bullishness
Dixon Technologies: Elliott Wave Chart ReadingDixon Technologies: CMP: 18006
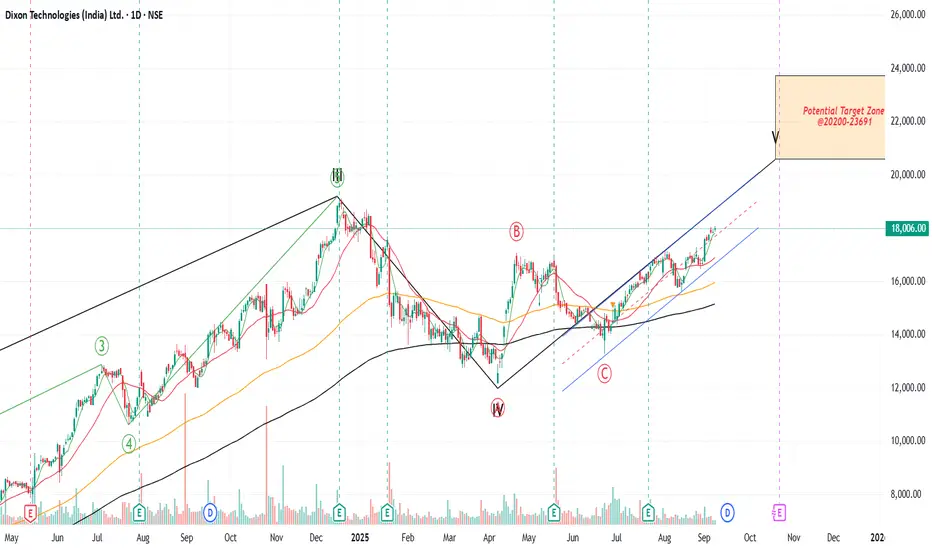
✨ Elliott Wave View: Dixon Technologies is currently exhibiting a classic Elliott Wave structure on the daily chart. The impulsive phase (waves 1, 2, 3, 4, 5) is well-formed, showing sustained upward momentum, followed by an a-b-c corrective sequence.
Wave V Uptrend: The stock has completed its a-b-c correction and is now progressing into wave V, with bullish structure and higher price targets in focus.
🛑 Support & Resistance: Strong support is observed around ₹17,000–₹17,800, aligning with moving averages and prior pivots; resistance is projected near ₹20,000–₹21,000, the next major Elliott extension.
📌 Strategy (Entry & Targets) :
Momentum Entry: If price breaks and sustains above ₹18,200, quick rally possible till ₹19,000–19,200. Stop Loss: ₹17,600
Avoid chasing now at ₹18,000 (overbought). Wait for dip toward ₹16,800–17,200 (good R:R)Prefer dips near ₹16,800–17,200 or breakout above ₹18,200.
T1: ₹18,800–19,200
T2: ₹20,500–21,200
📌 Thanks a ton for checking out my idea! Hope it sparked some value for you.
🙏 Follow for more insights
👍 Boost if you found it helpful
✍️ Drop a comment with your thoughts below!
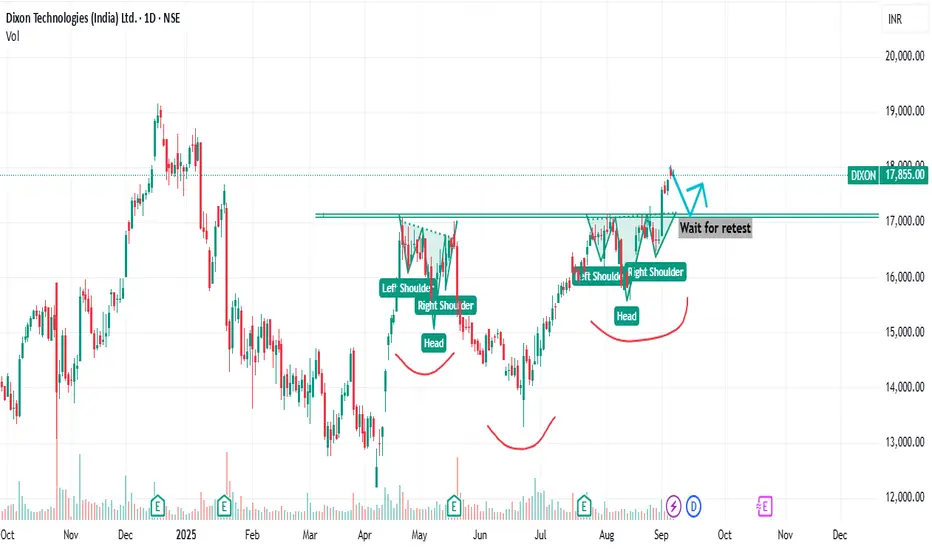
Multiple times testing breakout of H&SNSE:DIXON
Tested multiple time foe breakout, but this time shown the breakout wait for price to retest
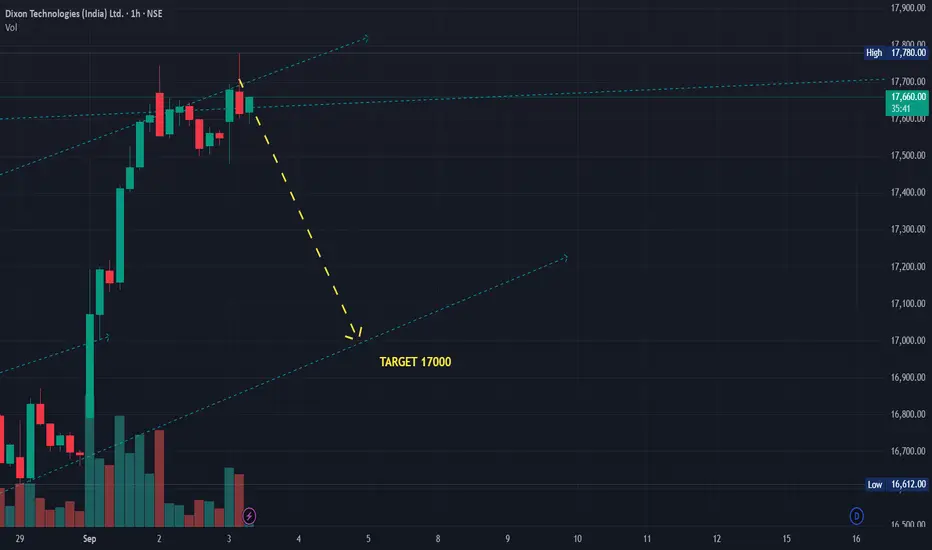
DIXON Short position - 1week overview and Price Targets AnalysisDIXON Short Term 1 week overview and Price Targets Analysis for Study Purpose only.
SHORT CMP around 17650 Target 17000 in next 5-10 days
SL if close in 1 hour candle is above the top channel in chart shown
DIXON Buy with breakout from a zone#dixon
Buy Dixon
Buy at Price - 17540
T1 - 18560
T2 - 19644
T3 - 20728
Keep Stoploss at 16390 Levels
Please take note : To understand the risks involved in the securities market, read the risk disclosures and disclaimers.
#dixon

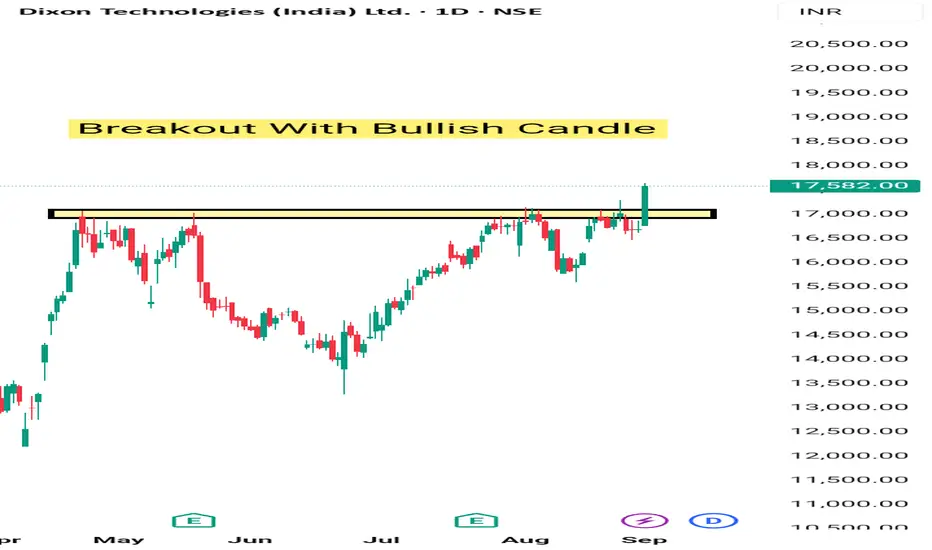
Dixon Breakout Tgt next 5-6%Dixon given breakout with high volume & made a clear breakout with bullish candle. It may give another 5 -6% Movement for swing trading . Stock is good for long term also . It's given breakout of rounding Bottom.
Dixon Inverted Head & Shoulder BreakoutDIXON Updated Chart :-
Breakout of Inverted Head & Shoulder Pattern with Huge Volume
Ready For Huge Movement with Target of Target 19000/20000/20725
Support at 16800/16500

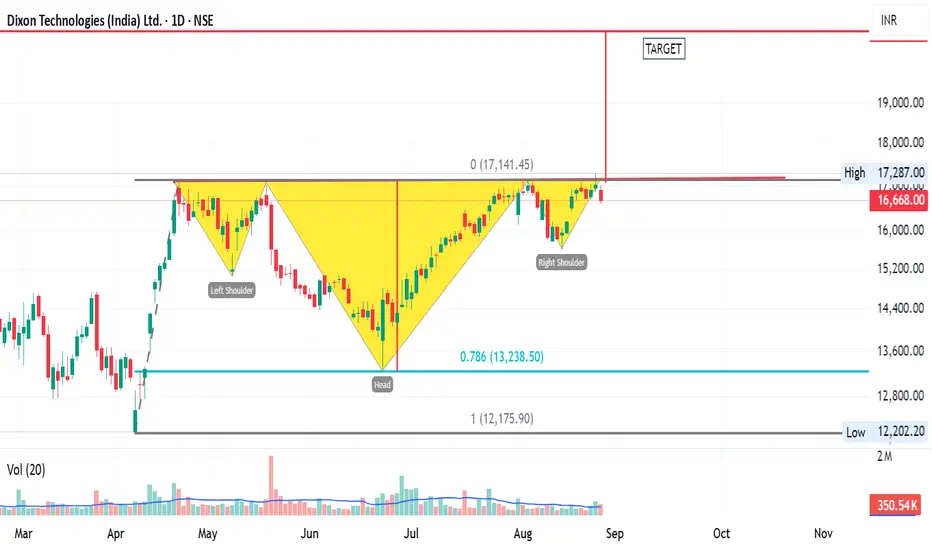
Dixon Inverted HnSDixon Technologies is making a inverted Head n shoulder in the daily timeframe.
One can look for taking an entry at the retest of 17300-17320. Support can be considered at todays low. Keep a Check on the Chart and you will get to see how a head n shoulder is made.
Usually the Support for a HnS is right shoulder low so mid term traders can consider that level.
Follow for such more Analysis.
Jai Shree Ram.

Inverse Head and Shoulder forming in DixonThe stock has formed Inverse Head and Shoulder pattern in daily time frame. But yet the breakout has not been done. It has retraced 78.6% of its last fall and bounced from there. Waiting for the breakout ,which hope should be done in very few days. lets see how it unfolds. Good luck and All the best. JUST FOR LEARNING AND EDUCATIONAL PURPOSE. Ty. JMK
DIXONDIXON
bullish trend is Showing on the chart.
buy signals in
technical indicators and
cup with handle , head and shoulders chart pattern.
Watch for a breakout above 17200/17300 to sustain the bullish trend. If the resistance holds, there could be a retest towards 16000/16100 and an uptrend from here.

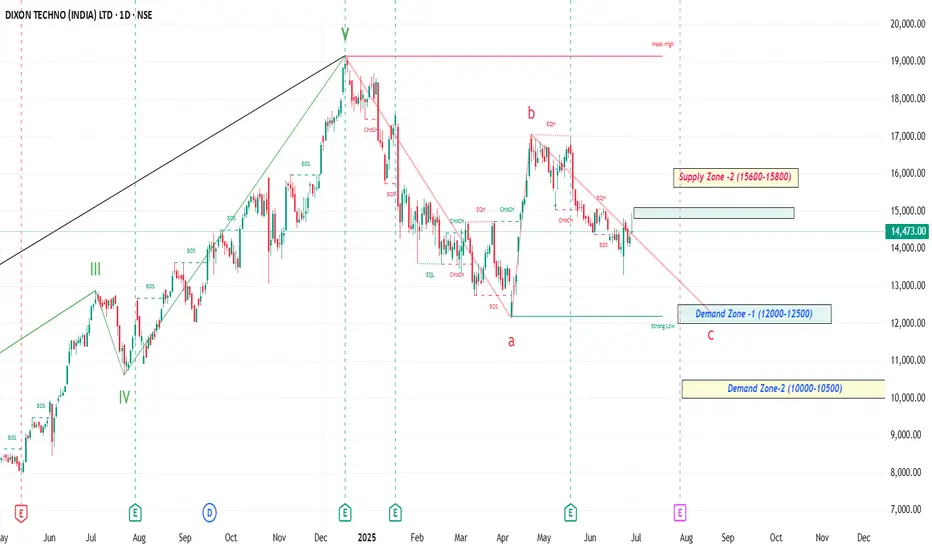
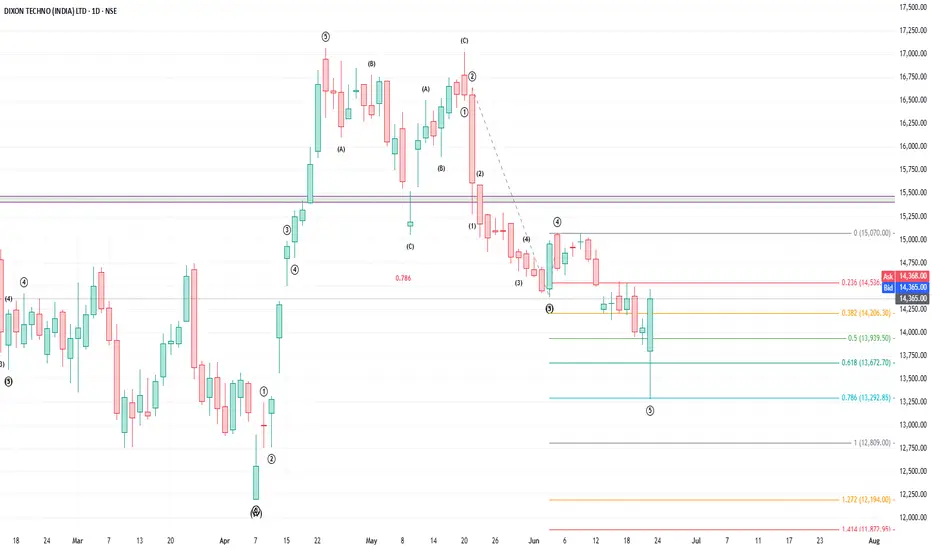
Dixon Technologies (India)- ongoing correctionDixon Technologies (India) Ltd: CMP: 14473
📊 Current Structure and Elliott Wave Count:
• The chart shows that the primary impulsive wave (Wave V) ended near ₹19,148, with the overall 5-wave structure completed.
• The stock has now entered a corrective ABC pattern:
o Wave a bottomed near ₹12141 .
o Wave b retraced to the ₹17,058 zone (a common retracement level near the 0.618–0.786 Fibonacci zone).
o Wave c appears to be unfolding, with a possible target zone marked near ₹12,000 (Strong Low Zone) , suggesting ongoing correction .
🔍 Key Price Action Observations:
• Multiple Break of Structure (BOS) and Change of Character (CHoCH) points indicate shifting momentum, mainly bearish.
• A supply zone are clearly marked near (0.382-05-0.618 retracement levels)
• The latest bounce is facing resistance near the 0.382 retracement level (~₹14,816) .
• The demand zone (Strong Low) is around ₹12,000–₹12,500 , which could act as a strong support for potential reversal if wave C completes.
🔮 Way Forward / Strategy:
✅ Bullish Scenario (Post Wave C Completion):
• Wait for Wave C to potentially complete near ₹12,000–12,500.
• Look for:
o Strong bullish reversal candlestick patterns.
o Break of structure/CHoCH on lower timeframes.
o Volume confirmation.
• Long Opportunity:
Accumulate near ₹12,000–12,500
SL below ₹11,800 and
Target ₹15,000–₹16,000+ (retracement of entire ABC).
❌ Bearish Continuation Risk:
• If price fails to hold above ₹13,000 and breaks below ₹12,000, expect further downside toward ₹10,000–10,500.
• Any long trade should be avoided until a clear reversal and confirmation of wave C completion.
📌 Thanks a ton for checking out my idea! Hope it sparked some value for you.
🙏 Follow for more insights
👍 Boost if you found it helpful
✍️ Drop a comment with your thoughts below!
Buy Dixon, Flat structure correction completed
Earlier I had published an idea on Dixon. The correction was in the form of a Flat (3-3-5) structure.
In the corrective 5-wave structure, sub-wave 3 developed as an impulse which extended the correction. This is not normal, however at times like this, it does happen.
Dixon had likely completed the 5th sub-wave at 0.786 fibo extension of sub wave 2-3-4.
All the wave markings are given in the chart.
Will update targets as the waves unfold.
Happy trading.
LONG CALL ON DIXON TECHNOLOGY About Company:--
Dixon Technologies (India) Limited, incorporated in 1993 , is a Electronic Manufacturing Services (EMS) company with operations in the electronic products vertical such as consumer electronics, lighting, home appliance, closed-circuit television cameras (CCTVs), and mobile phones. It also undertakes reverse logistics operations. Besides, it manufactures security surveillance equipment, wearables & audibles, AC-PCBs. Recently, it has entered a JV with Imagine Marketing Private Limited for designing and manufacturing wireless audio solutions in India.
Technical pattern : Cup with handle formed and breakout occured on thursday around 16500 levels. The depth of the cup is approximately 2000 points. So I am expecting the stock may move upto 18500 levels from here so investors can add these stock around 16500 levels to their portfolios.
Aggressive entry price : CMP
SAFER ENTRY POINT : 16500
STOP LOSS :16100
1st target : 17500
2nd target : 18000
Time period : 6 months
Disclimer :I AM NOT A SEBI RESEARCH ANALYST OR FINANCIAL ADVISOR, these recommendations are only for education purpose, not for trading and investment purpose please take an advise from your financial advisor before investing on my recommendations.
🙏 : If you liked my content please suggest to your friends follow my trading channel. Your likes and comments provide boosting to me to update more financial information.
Thanking you
Dixon at resistance levelDixon tech is at resistance level. Chances of breaking out of the resistance. Buy the stock after breakout.

Dixon Technologies Ltd – Breakout Alert📈Technical Analysis
Dixon Technologies Ltd has shown a strong long-term uptrend since 2018, following a consistent Buy-on-Dips structure. The stock hit its All-Time High in Dec 2024, post which it corrected nearly 36%, forming a series of Lower Highs.
Currently, it's trading at ₹16,556, and today it broke the most recent Lower High, indicating a potential trend reversal. Interestingly, this technical breakout aligns with strong Q4 results, further supporting bullish sentiment.
The next key resistance lies at ₹17,000 – an earlier lower high. A breakout above this level, followed by a bullish retest, could pave the way for a fresh rally.
🎯Upside Targets:
🎯Target 1: ₹17,500
🎯Target 2: ₹18,000
🎯Target 3: ₹18,500
🛡️Key Support Levels:
₹14,000 (Minor Support)
₹12,000 (Major Demand Zone)
If these supports fail, the bullish structure may be invalidated.
💰FY24 Financial Performance (vs FY23 & FY22)
Total Income: ₹38,860 Cr (↑ +120% vs ₹17,691 Cr; ↑ +219% vs ₹12,192 Cr)
Total Expenses: ₹37,353 Cr (↑ +120% vs ₹16,988 Cr; ↑ +215% vs ₹11,873 Cr)
Financing Profit: ₹1,508 Cr (↑ +114% vs ₹705 Cr; ↑ +190% vs ₹519 Cr)
Profit Before Tax: ₹1,570 Cr (↑ +218% vs ₹494 Cr; ↑ +355% vs ₹345 Cr)
Profit After Tax: ₹1,233 Cr (↑ +228% vs ₹375 Cr; ↑ +384% vs ₹255 Cr)
EPS: ₹181.87 (↑ +196% vs ₹61.47; ↑ +325% vs ₹42.90)
📌Exceptional growth across all metrics indicates robust demand, streamlined costs, and successful scaling.
🔍Fundamental Strengths
CAGR & Profitability: 45%+ revenue CAGR over 5 years, with ROE ~28%
FY25 Estimates: Revenue at ₹38,860 Cr (+120%) and PAT at ₹1,100 Cr (+198%)
Q4 Highlights: PAT jumped 322% YoY to ₹401 Cr on a 121% surge in revenue to ₹10,293 Cr
Financial Discipline: Minimal debt (total debt/ equity ~0.07), strong cash flows, and high asset turnover
Operational Scale: 17 manufacturing units; JV with Vivo in Dec 2024 indicates strategy expansion
✅Conclusion
Dixon is showing a compelling technical breakout, backed by outstanding FY24 and Q4 results. Uptick above ₹17,000 with solid support suggests continuation toward ₹18,500. Strong fundamentals reinforce medium‑term potential, but critical stops at ₹14,000 and ₹12,000 should be respected.
Disclaimer: lnkd.in
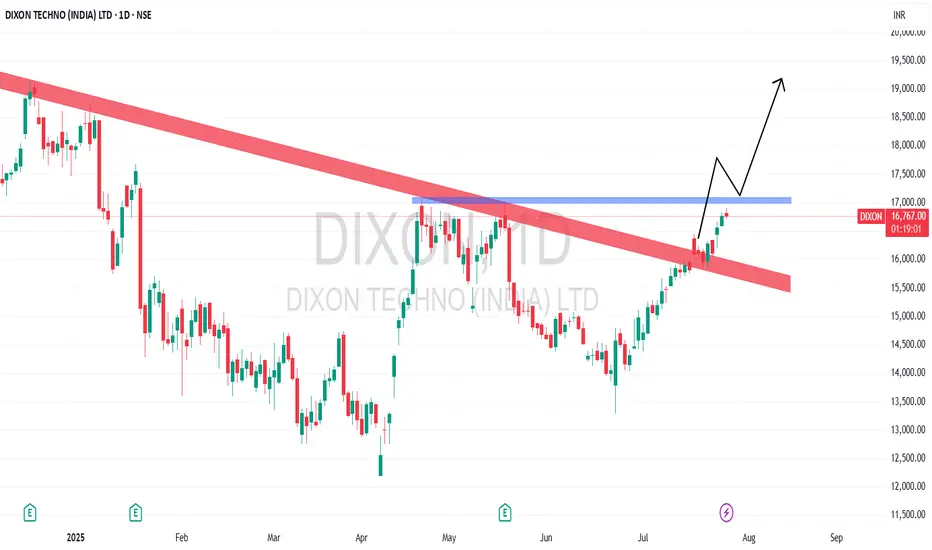
DIXON TECH – Nearing a Big Breakout Zone!Dixon Technologies is getting close to a major trendline resistance that has been holding the stock down since December 2024. But now, the chart is showing strong signs of a possible breakout after a solid uptrend in recent weeks.
* What the chart shows:
Price is moving up strongly and is now near the resistance trendline (~16,700 zone).
Dixon Tech has been rising steadily and is now testing a long-term trendline that has previously acted as a ceiling. If it breaks above this level with good strength, it may open the door to a new rally.
It is trading above the 200-day moving average, showing strength.
The price has moved above the 200-DMA (blue line), which is a key level watched by traders and investors. This shows that the overall trend is positive and that buyers are in control.
MACD indicator is giving a bullish signal – supporting upward momentum.
MACD is showing a bullish crossover, which means momentum is picking up. This adds more confidence that the stock may continue to rise in the near term.
Volume is rising on green candles – this shows strong buying interest.
Higher volume on up days means more traders are participating in the up move. This buying interest is a strong confirmation that the market supports the current uptrend.
* Conclusion:
If Dixon breaks and closes above the trendline with strong volume, we could see a powerful breakout. This chart is worth keeping on your watchlist for a possible trading opportunity.
What’s your view? Will Dixon break out or face resistance again?
