DIXON - Triangle & TrendlineTriangle and Trendline breakout forming on the 2H Chart of DIXON TECH. BUY 5400 , SL 5240-200, 5100, 5050, 4850, Target(s) - 5700, 6000, 6140, ATH, 6500.
DIXON trade ideas

DIXONNote:
1. Views are personal and for educational purposes only. Recheck and take the trade as per your RR.
2. Always remember SL is your lifeline, not the big target...
3. Follow us for more patterns and like, share so that we feel it is helpful to many and share more patterns...
3. Views given here is not a tip rather it is for educational purpose... Aftermarket opens, the condition might change so learn to handle different conditions...
4. To learn more about patterns, Psychology behind the trade, and price action trading... contact us... Thanks...
Keep an eye ladies and gentlemen. Cheers and Happy Trading

DIXON TECHNOLOGIES Head and shoulder patternDIXON TECHNOLOGIES
made head and shoulder pattern in Daily time frame and also in hourly time frame..
Wait for Head and shoulder pattern breakout..
for short term trades
Stoploss below 5389
Target 1 : 5845
Target 2 : 6045
Target 3 : 6195
for education purpose only...

Dixon Tech - 4th Top breakout anticipatedAll trade ideas provided are the opinions of the publisher and should not in any way be considered as financial advice. Please do your own research and consult your advisor before investing in stock markets


DIXON HH- HL FORMATION
This STOCK IS READY FOR THE BREAKOUT ON UPSIDE . HH HL FORMATION AND W PATTERN IS ALSO VISIBLE MINIMUM TARGET MUST BE ATH , with stoploss in previous swing low


Volatility Contraction PatternStrong uptrend followed by long consolidation with volatility contraction on low volumes
Respecting 50 DMA

[ INTRADAY ] DIXON SHORT BET
risk: Reward ratio is 1: 2
Rest as per Charts
********
Note -
One of the best forms of Price Action is to not try to predict at all. Instead of that, ACT on the price. So, this chart tells “where” to act in “what direction. Unless it triggers, like, let’s say the candle doesn’t break the level which says “Buy/Sell if it breaks”, You should not buy/sell at all.
=======
I use shorthands for my trades.
“Positional” - means You can carry these positions and I do not see sharp volatility ahead.
“Intraday” -means You must close this position at any cost by the end of the day.
=======
Always follow a stop loss.
In the case of Intraday trades, it is mostly the “Low/High of the Candle”.
In the case of Positional trades, it is mostly the previous swings
********

Buy 5662 TGT 5711 and 5800 SL 5593Suggestions are based on my analysis only. Please do your analysis before taking any trade.

Dixon TechnologyDixon Technology
Above 5500
Target zone 5580,5652,5733,5845
Below 5380
Target 5260,5220,5100

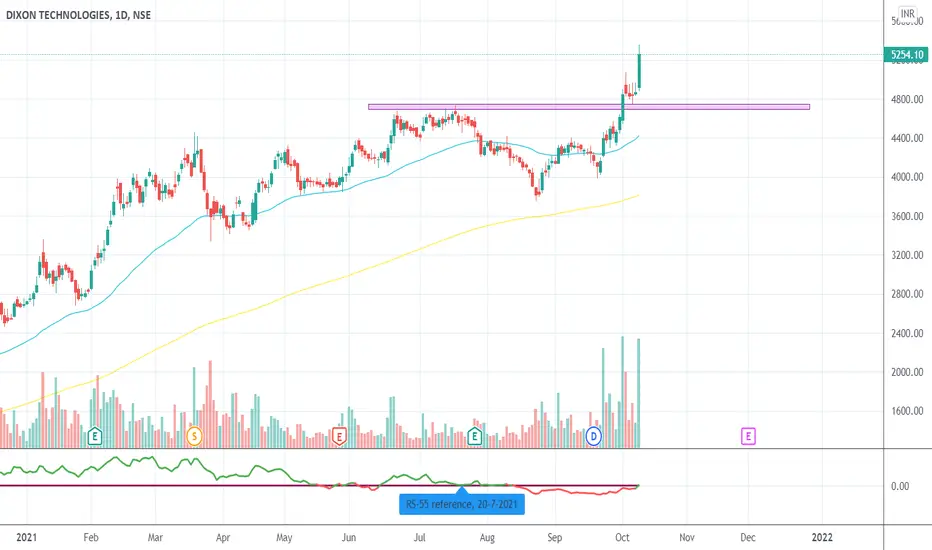
DIXION - Triple top and Triple bottomDIXION is a very strong stock and has been in uptrend for a very long time.
in the past it has broken the strong resistance 4800 and is now a support of the breakout, same might happen if the triple bottom bounces back to resistance (5529) and give a breakout to create a new support.
till then we have to wait and watch. good to buy at support


DIXON: ITS-ON?RSI has good strength, 3OW MA has crossed price while sloping upwards and has again gone below CMP, a very good sign of strength, if crosses 5615, full fledged rally will be there.

Buy above 5585 SL 5540 TGT 5650 and 5730Suggestions are based on my analysis only. Please do your analysis before taking any trade.

Dixon flag and pole patternDixon is forming a flag and pole pattern on 15 mins time frame. You can go long when a 15 min candle closes above 5520
Targets : 5550,5580,5600


Price bounce from 50% retracement level in DixonPrice bounce from 50% retracement level in Dixon
Detailed analysis given on the chart
NSE:DIXON

DIXON | Good looking Cup & Handle chart with trendline - 18%DIXON | Good looking Cup & Handle chart with trendline - 18%
CMP : 4427 (Dip : 4340)
SL : 4050
Target : 5200
1:2.5+ risk reward setup

#Dixontech cash : Positional tgt 6200 #DixonTech cash -Positional call
09.Nov.2021
Looks good around 5650
Stoploss 5500
Target 6200
Cmp 5660

Dixon Tech Breakout - Retest -Moving upA successfull breakout , Followed by a retest and again an up move . A high probabilty long trade setup .