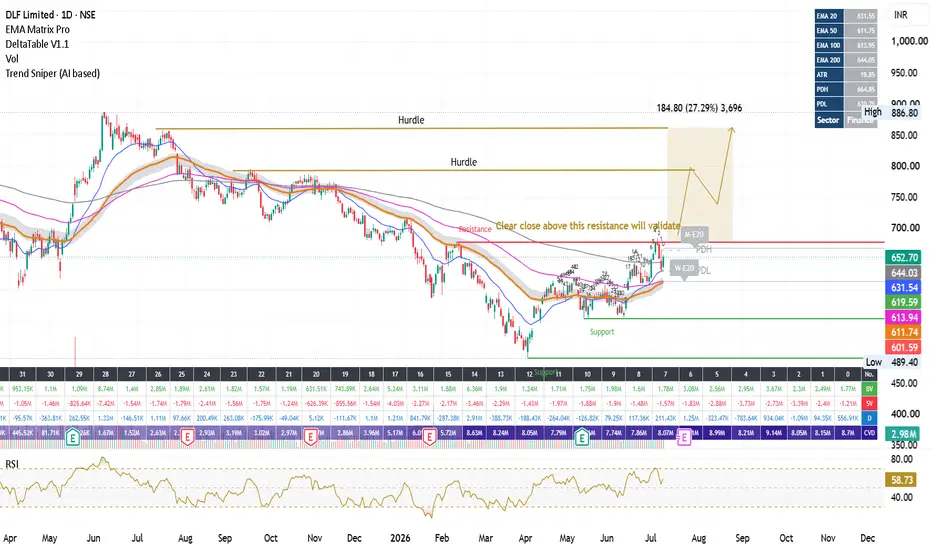
Five Years Of Support Is Setting Up The Next Expansion
DLF is again showing why this long-term rising support is so important. This trendline has been protecting the larger structure for almost five years and every major correction towards it has eventually attracted buyers. The latest fall towards the 480–500 area was also absorbed aggressively and pr
Compare with DLF Limited
17.95 INR
44.15 B INR
81.94 B INR
639.89 M
Next report date
—
Report period
—
EPS estimate
—
Revenue estimate
—
Company info
Sector
Industry
Website
Headquarters
Gurugram
Founded
1946
IPO date
Jul 9, 2007
ISIN
INE271C01023
FIGI
BBG000N9DGW9
Identifiers
ISIN INE271C01023
DLF Ltd. engages in the business of colonisation and real estate development. It also focuses on leasing, maintenance services and recreational activities related to the development of real estate. The company was founded by Chaudhury Raghvendra Singh on September 18, 1946 and is headquartered in Gurugram, India.
The Golden Marubozu Trap : A Price Action Strategy StudyThis historical March 2026 study demonstrates a framework I call the Golden Marubozu Trap Setup. Using older than 3 months charts here to showcase a concept for educational purposes only
It starts on the Monthly timeframe.
First, I identify a significant Swing Low → Swing High and apply Fibonac
DLF - Multi time frame analysisThere are different patterns in the chart. in lower and higher time frames. In the lower time frame, the price is moving in a descending channel and in the daily time frame, the price is moving in an ascending channel.
Considering all these facts, if the price shows bullish strength at the 650 zone
DLF — Reclaiming EMAs After Multi-Year Trendline Support TestOverview
DLF has staged a sharp move today (+3.96%, closing at 685.75), reclaiming both its 50 EMA (615) and 200 EMA (645) after a multi-month downtrend from the 2024 high of 967.60. This bounce comes off a well-established rising trendline that has held since 2021, having been tested and respected
DLF: Early Stage 2 Transition / Momentum Breakout SetupDLF appears to be transitioning into an early Stage 2 uptrend after reclaiming the 200-day moving average and establishing a series of higher highs and higher lows. The recent breakout from the multi-month base occurred on expanding volume, suggesting improving institutional participation. While pri
DLF seems to be in an upward swing moveDLF seems to have completed wave B/2 on daily timeframe and entered Wave C/2
This will provide as buy on dips opportunity for swing momentum
The count will be invalidated below 550
The first target could be expected of ~660
HAPPY TRADING
MAY THE TREND BE WITH YOU!
DLF : structural transitionNSE:DLF
DLF is showcasing a clean structural transition from a deep accumulation phase following its correction from 52-week highs.
Technical Observation:
- Price has reclaimed key daily EMAs (20, 50, 100, and 200), trading firmly at ₹655.20.
- A classic demand-supply flip is taking shape ab
See all ideas
Summarizing what the indicators are suggesting.
Neutral
Neutral
Neutral
An aggregate view of professional's ratings.
Neutral
Neutral
Neutral
Displays a symbol's price movements over previous years to identify recurring trends.
Frequently asked questions
The current price of DLF is 648.60 INR — it has increased by 1.83% in the past 24 hours. Watch DLF Limited stock price performance more closely on the chart.
Depending on the exchange, the stock ticker may vary. For instance, on NSE exchange DLF Limited stocks are traded under the ticker DLF.
DLF stock has fallen by −2.39% compared to the previous week, the month change is a −3.22% fall, over the last year DLF Limited has showed a −10.78% decrease.
We've gathered analysts' opinions on DLF Limited future price: according to them, DLF price has a max estimate of 1,000.00 INR and a min estimate of 695.00 INR. Watch DLF chart and read a more detailed DLF Limited stock forecast: see what analysts think of DLF Limited and suggest that you do with its stocks.
DLF stock is 2.51% volatile and has beta coefficient of 1.61. Track DLF Limited stock price on the chart and check out the list of the most volatile stocks — is DLF Limited there?
Today DLF Limited has the market capitalization of 1.58 T, it has decreased by −0.96% over the last week.
Yes, you can track DLF Limited financials in yearly and quarterly reports right on TradingView.
DLF Limited is going to release the next earnings report on Oct 29, 2026. Keep track of upcoming events with our Earnings Calendar.
DLF earnings for the last quarter are 3.20 INR per share, whereas the estimation was 4.18 INR resulting in a −23.54% surprise. The estimated earnings for the next quarter are 4.37 INR per share. See more details about DLF Limited earnings.
DLF Limited revenue for the last quarter amounts to 12.80 B INR, despite the estimated figure of 20.83 B INR. In the next quarter, revenue is expected to reach 18.81 B INR.
DLF net income for the last quarter is 7.94 B INR, while the quarter before that showed 12.69 B INR of net income which accounts for 0.00% change. Track more DLF Limited financial stats to get the full picture.
DLF Limited dividend yield was 1.59% in 2025, and payout ratio reached 44.86%. The year before the numbers were 0.88% and 34.00% correspondingly. See high-dividend stocks and find more opportunities for your portfolio.
As of Oct 10, 2026, the company has 4.31 K employees. See our rating of the largest employees — is DLF Limited on this list?
EBITDA measures a company's operating performance, its growth signifies an improvement in the efficiency of a company. DLF Limited EBITDA is 12.35 B INR, and current EBITDA margin is 18.55%. See more stats in DLF Limited financial statements.
Like other stocks, DLF shares are traded on stock exchanges, e.g. Nasdaq, Nyse, Euronext, and the easiest way to buy them is through an online stock broker. To do this, you need to open an account and follow a broker's procedures, then start trading. You can trade DLF Limited stock right from TradingView charts — choose your broker and connect to your account.
Investing in stocks requires a comprehensive research: you should carefully study all the available data, e.g. company's financials, related news, and its technical analysis. So DLF Limited technincal analysis shows the sell today, and its 1 week rating is sell. Since market conditions are prone to changes, it's worth looking a bit further into the future — according to the 1 month rating DLF Limited stock shows the neutral signal. See more of DLF Limited technicals for a more comprehensive analysis.