ECLERX another entry set upECLERX traded in a narrow range today, with the price displaying a consolidative pattern through most of the session. The stock opened flat and witnessed brief upward movements, but overall momentum remained muted as it hovered near key support levels. Intraday volatility was low, with buyers and sellers appearing evenly matched and no clear directional bias emerging.
Price action suggests market participants are awaiting fresh cues before taking definitive positions, with the stock holding above a short-term moving average. Technical indicators point to a neutral stance, as neither bullish nor bearish signals have dominated trade today. The immediate outlook remains sideways unless there is a decisive break above the session high or below the established support zone.
ECLERX trade ideas

eClerx Services Limited Long term Bet **eClerx Services Limited** is fundamentally strong but currently appears to be overvalued, with technical indicators showing mixed signals for short-term momentum. The target for the next six months ranges between ₹4,050 and ₹4,500, reflecting moderate upside potential, though valuations and profit booking may cause volatility.
## Fundamental Analysis
- **Revenue & Profit**: Trailing twelve months (TTM) revenue is ₹3,518 crore, with net profit at ₹571 crore. The company boasts healthy gross margins (~36%) and a solid net profit margin (~16%).
- **Valuation**: P/E ratio is 36.16 (TTM), making it expensive compared to sector peers; P/B stands at 9.21 and P/S at 5.87. The stock trades at a 51% premium to estimated intrinsic value (~₹2,860); fair value models cluster between ₹2,098 and ₹2,872.
- **Dividend & Shareholding**: Dividend payout is modest (₹1.00 per share, upcoming October 2025). Promoters hold the majority stake (53.8%), with high FII and DII interest.
- **Sector & Business Model**: eClerx serves top global sectors like finance, telecom, retail, offering advanced analytics and business process management. Expansion in US/Europe and digital solutions provide growth levers.
## Technical Analysis
- **Trend and Momentum**: Recent charts indicate a trading range bound near ₹4,300–4,400, with recent resistance near ₹4,588. Risk/reward ratios for short-term trades are favorable, but overall technical indicators lean towards 'Strong Sell'—a cautionary sign suggesting limited momentum in the near term.
- **Market Moves**: The stock fell 2.5% on September 5, but recovered in the following days, with volume profile indicating decent buyer interest below ₹4,300.
- **Support and Resistance**: Key support seen near ₹4,220–4,250; resistance is likely at ₹4,588. A break above ₹4,450 could open higher targets, while losses below ₹4,220 may trigger downside towards ₹4,050.
## Six-Month Target
| Source | Target (INR) | Time Frame |
|--------------|-------------------|--------------|
| TradingView | 4,053–4,500 | 6 months |
| Analyst Consensus | ~4,200–4,450 | 6 months |
| Technical Pivot | ~4,360 (current), with breakout potential to 4,588 | 6 months |
Analysts expect eClerx to trade between ₹4,050 and ₹4,500 over the next six months, with potential upside if business momentum and sector conditions remain favorable.
## Investment Outlook
- **Positives**: Strong fundamental growth, diversified business model, and consistent margins support long-term investment.
- **Risks**: High valuation premium, sector rotation, and overbought technicals may lead to periodic corrections.
- **Verdict**: eClerx Services is fundamentally robust but requires cautious approach for fresh entries given its premium pricing; ideal for accumulation on dips with a target up to ₹4,500 if sector tailwinds persist.
Here is a detailed table of **ROCE, ROE, CAGR, fair value, resistance, support, and 6-month target** for eClerx Services Limited, compiled from current data and recent technical levels:
| Metric | Value/Level | Source/Remarks |
|-----------------|---------------------------|-------------------------------------------------------|
| **ROCE** | 33.1% | Strong efficiency; sector-leading |
| **ROE** | 23.4%-24.3% | Latest 2025 values; robust |
| **CAGR (5Y)** | ~57% | 5-year annual return |
| **Fair Value** | ₹2,860 | Median intrinsic valuation |
| **1-Year High** | ₹4,640 | Technical resistance zone |
| **1-Year Low** | ₹2,168 | Technical support zone |
| **Current Price** | ₹4,338 | As of Sept 2025 |
| **Resistance** | ₹4,450–₹4,640 | Next upside hurdles |
| **Support** | ₹4,220–₹4,250 | Immediate downside guards |
| **Target (6M)** | ₹4,050–₹4,500 | Analyst/technical forecast |
All numbers are based on consolidated, trailing twelve months (TTM), annual returns, and latest analyst consensus as of September 2025.
- **ROCE** and **ROE** reflect strong operational and equity efficiency, supporting higher valuations.
- **CAGR** (~57%) shows powerful historical wealth creation, though fair value (₹2,860) warns of premium pricing.
- Support/resistance/target levels reflect current chart analysis and expert views for next six months.

ECLERX SKYROCKETS 35%! This Pattern Signals ₹4,200 TargetNSE:ECLERX SKYROCKETS 35%, Made a Beautiful Chart Structure to Qualify for the Chart of the Week
Price Action:
- It experienced a powerful rally from ₹2,200 to ₹3,877 (all-time high) between July and October 2024
- Recent correction formed a descending wedge pattern from October 2024 to early May 2025
- Currently showing an explosive breakout at ₹3,301.80, up ₹852.40 (+34.80%) in this Week.
- Massive single-week gain with a long bullish candle breaking above both resistance levels and the downtrend line
- The weekly chart shows a strong V-shaped recovery from support
Volume Analysis:
- This Week's volume at 2.28M shares vs. average of 420.79K (over 5x normal volume)
- Previous support bounces have also witnessed above-average volume
- Extremely high volume on today's breakout suggests significant institutional participation
- Volume pattern confirms the legitimacy of the price action
Key Support and Resistance:
- Strong support zone at ₹2,200-2,300 (green horizontal box) - tested and held multiple times over the past year
- Previous resistance now likely support at ₹3,200-3,250 (green horizontal line)
- Next resistance at all-time high of ₹3,877 (marked as "High")
- Downtrend line (white diagonal) now broken with conviction
Technical Patterns:
1. Descending Wedge Breakout- Classic bullish reversal pattern completed this week
2. Double Bottom*- Formed at ₹2,300 level in March-May 2025
3. Support Retest- Successfully retested the major support zone before the breakout
4. V-Shaped Recovery - Strong reversal indicating powerful buying interest
Trade Setup:
- Pattern: Descending wedge breakout with volume confirmation
- Confirmation: Explosive price action and volume expansion
- Context: Bullish reversal after testing major support zone
Entry Points:
1. Aggressive Entry: Current price (₹3,301.80) with partial position
2. Pullback Entry: On retest of breakout level ₹2,900-3,000
3. Confirmation Entry: On consolidation and holding above ₹3,200 for 2-3 sessions
Exit Strategy:
- Target 1: ₹3,600 (psychological resistance)
- Target 2: ₹3,877 (previous all-time high)
- Target 3: ₹4,200 (pattern projection based on measured move)
- Trailing Stop: 7% trailing stop after Target 1 is achieved
Stop Loss Placement:
- Aggressive Stop: ₹2,950 (below recent swing low)
- Conservative Stop: ₹2,800 (near the breakout point of the wedge)
- Pattern-Based Stop: ₹2,500 (invalidation level for the pattern)
Risk Management:
- Position sizing: Limit risk to 1-2% of trading capital
- Risk-reward ratio: Minimum 1:1.5 for aggressive entry, 1:2 for pullback entry
- Consider scaling approach:
* Enter 50% position now
* Add 25% on confirmation of trend (holding above ₹3,200)
* Add 25% on pullback (if it occurs)
- Take partial profits: 30% at Target 1, 30% at Target 2, hold remainder with trailing stop
NSE:ECLERX shows a powerful technical setup with its powerful breakout from a descending wedge pattern on record volume. The price action respects key technical levels, with the stock holding major support at ₹2,200-2,300 before staging today's massive rally. The breakout above both the wedge pattern and horizontal resistance, with 5x normal volume, suggests potential for continued upside momentum toward previous highs and beyond.
Keep in the Watchlist.
NO RECO. For Buy/Sell.
📌Thank you for exploring my idea! I hope you found it valuable.
🙏FOLLOW for more
👍BOOST if you found it useful.
✍️COMMENT below with your views.
Meanwhile, check out my other stock ideas on the right side until this trade is activated. I would love your feedback.
Disclaimer: "I am not a SEBI REGISTERED RESEARCH ANALYST AND INVESTMENT ADVISER."
This analysis is intended solely for informational and educational purposes and should not be interpreted as financial advice. It is advisable to consult a qualified financial advisor or conduct thorough research before making investment decisions.

BUY TODAY SELL TOMORROW for 5%DON’T HAVE TIME TO MANAGE YOUR TRADES?
- Take BTST trades at 3:25 pm every day
- Try to exit by taking 4-7% profit of each trade
- SL can also be maintained as closing below the low of the breakout candle
Now, why do I prefer BTST over swing trades? The primary reason is that I have observed that 90% of the stocks give most of the movement in just 1-2 days and the rest of the time they either consolidate or fall
Round Bottom Breakout and Retest in ECLERX
BUY TODAY SELL TOMORROW for 5%

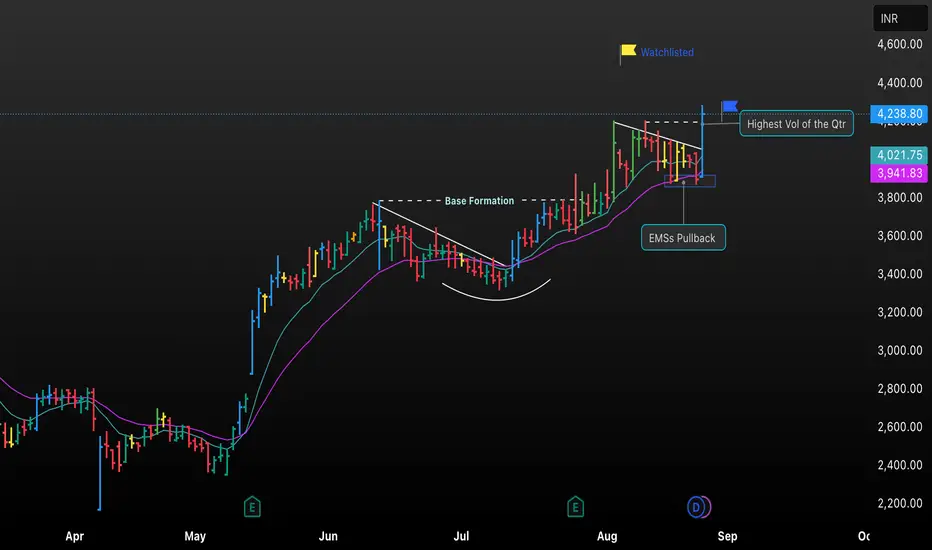
ECELRX Breakout: Strong Volume Surge & Bullish SetupECELRX has formed a solid base and recently broke out above its prior consolidation zone, supported by the highest volume of the quarter and a successful pullback to the exponential moving averages (EMAs). The chart highlights a clean base formation, a healthy retracement, and renewed buying interest—confirming bullish momentum. This setup could signal continuation if the stock holds above key EMA levels; caution is advised on any breakdown below the pullback zone
Eclerx weekly breakout This stock in uptrend . This given breakout on weekly & daily time frame. It's good buy for 5 -10% Swing Trading movement. It's in uptrend. Keep stoploss of 5% . Consult your financial advisor before making any position in stock market. My all views are for educational purposes only.

Eclerx Price ActionEclerx Services Limited has demonstrated a strong price rally in August 2025, reaching levels above ₹4,200, which is close to its 52-week high. The stock has shown solid upward momentum supported by consistent quarterly earnings growth and robust operational performance. Despite trading at a premium valuation with a price-to-earnings ratio in the mid-30s and a price-to-book ratio around 8, the market perceives the company as a leader in the IT-enabled services sector, warranting the premium.
The company’s financials reveal stable revenue streams of over ₹3,500 crore annually, with profit margins holding steady around the mid-teens percentage, reflecting operational efficiency. Eclerx maintains a strong balance sheet with negligible debt and healthy returns on equity and capital employed, underlining management’s efficient capital utilization.
Technically, Eclerx is trading above its key moving averages, indicating positive price momentum, though some short-term trading signals suggest potential for minor pullbacks. Dividend payouts have been regular but modest, corresponding to the firm's focus on growth reinvestment. Overall, Eclerx Services presents a fundamentally sound profile with growth prospects, making it attractive for investors with a medium to long-term horizon, though valuation levels suggest a need for cautious entry timing.

ECLERX | Ideal Retracement Zone Identified📉 White Lines — Multiple DTF trendlines, including the key falling counter-trendline (CT), were decisively broken. The breakout marks the end of a strong downward structure with excellent follow-through.
🟧 Orange Line — Major Monthly Time Frame (MTF) resistance lies just overhead.
🔍 Breakout Candle:
Exceptionally strong with a close near high.
Backed by 1.83M volume, showing strong institutional interest.
Pattern size is large — adding weight to the structural reversal.
⚠️ Caution: A large portion of the move seems to have already played out within one candle. Chasing here risks poor R:R due to limited space before overhead resistance.
📐 Strategy Setup:
Fibonacci Retracement plotted on the breakout candle.
Ideal entry zone highlighted in green between the 0.382 to 0.5 levels
This zone represents a healthy and probable pullback area, offering better risk-reward alignment for potential continuation.
🧭 Trade Idea: Avoid chasing. Instead, watch for a retracement to the green zone. If price reacts positively there, it could offer a technically strong R:R opportunity while staying aligned with the broader breakout narrative.

ECLERX: Pullback entry is looking good for 20-25% move1. Overall structure is bullish.
2. Price trading near the EMA support & Fib retracement levels.
3. RRR is okay, but not great.
⚠️ Disclaimer: This is NOT a buy/sell recommendation. This post is meant for learning purposes only. Views are personal. Please, do your due diligence before investing.⚠️
💬 What are your thoughts on this share it in the comments below. ✌️
🔥 Happy Trading!✅🚀

BUY TODAY SELL TOMORROW for 5%DON’T HAVE TIME TO MANAGE YOUR TRADES?
- Take BTST trades at 3:25 pm every day
- Try to exit by taking 4-7% profit of each trade
- SL can also be maintained as closing below the low of the breakout candle
Now, why do I prefer BTST over swing trades? The primary reason is that I have observed that 90% of the stocks give most of the movement in just 1-2 days and the rest of the time they either consolidate or fall.
Trendline Breakout in GOKUL
BUY TODAY SELL TOMORROW for 5%

Eclerx Services Limited - Breakout Setup, Move is ON...#ECLERX trading above Resistance of 3745
Next Resistance is at 4348
Support is at 3185
Here are previous charts:
Chart is self explanatory. Levels of breakout, possible up-moves (where stock may find resistances) and support (close below which, setup will be invalidated) are clearly defined.
Disclaimer: This is for demonstration and educational purpose only. This is not buying or selling recommendations. I am not SEBI registered. Please consult your financial advisor before taking any trade.

Eclerx Services Limited - Long Setup, Move is ON...#ECLERX trading above Resistance of 2696
Next Resistance is at 3745
Support is at 1792
Here are previous charts:
Chart is self explanatory. Levels of breakout, possible up-moves (where stock may find resistances) and support (close below which, setup will be invalidated) are clearly defined.
Disclaimer: This is for demonstration and educational purpose only. This is not buying or selling recommendations. I am not SEBI registered. Please consult your financial advisor before taking any trade.

ALL TIME HIGH BREAKOUTEclerx services LTD has given breakout of all time high with good volume on both daily and weekly timeframe.

Amazing breakout on Weekly TF - ECLERXCheckout an amazing breakout happened in the stock in Weekly timeframe.
IMPORTANT BREAKOUT LEVELS ARE ALWAYS RESPECTED!
NOTE for learners: Place the breakout levels as per the chart shared and track it yourself to get amazed!!
#No complicated chart patterns
#No big big indicators
#No Excel sheet or number magics
PS: No new Nifty500 script can escape from me when making a breakout. :-)
PS: This script is shared 1-2 days delayed. Sorry for the delayed charts.
Breakouts happening in longer timeframe is way more powerful than the breakouts seen in Daily timeframe. You can blindly invest once the weekly candle closes above the breakout line and stay invested forever. Also these stocks breakouts are lifelong predictions, it means technically these breakouts happen giving more returns in the longer runs. Hence, even when the scrip makes a loss of 10% / 20% / 30% / 50%, the stock will regain and turn around. Once they again enter the same breakout level, they will flyyyyyyyyyyyy like a ROCKET if held in the portfolio in the longer run.
Time makes money, GREEDY & EGO will not make money.
The real deal is when to purchase and where to purchase the stock. That is where Breakout study comes into play.
Catching the early birds in the stock market and not everyone (especially retail traders) can do it. The art is investing fixed amount equally in every stock and let the law of numbers work on compounding in the longer run,
Example: 5000/- invested equally in all BO stocks where out of 15 stocks only 1-2 stocks goes beyond -50% SL, where rest of the stocks flies like an eagle. The secret recipe is "Patience with correct study" and "Large diversification" and "TIME"

EClerx Services weekly E Clerx services weekly
CMP 2476
Forming W pattern in weekly
Previous All time high breakout and retest done
Moving in a channel.
Can enter with Sl of last swing low
Disclaimer : For educational purpose only no buy sell recommended.

ECLERX - SWING TRADE - 14th January #stocksECLERX (1D TF) - Swing Trade Analysis given on 14th Jan, 2024
Pattern: ASCENDING TRIANGLE
- Volume Spike at Resistance - Done ✓
- Breakout - In Progress
- Retest & Consolidation - In Progress
#stocks #swingtrade #chartanalysis #priceaction #traderyte #eclerx

ECLEREXfor intraday looking good above 2690 stock trading in the range at 3day if break 2690 with higher low it will go up
NOTE: only for educational purpose
RULE: 1: always trade with stoploss
2: decide your risk per trade and per day
3: believe to your analysis
4: stay positive and keep patience
technical analysis + money management+ physicalogy = successful trader

eClerx Services Ltd - ATH Breakout eClerx Services Ltd and given a ATH breakout. on a shorter time frame it has broken out of flag pattern as well. With RSI above 60, positive MACD, we can expect a good movement and expect an increase of 50% from current price.
"Clean Charts, Easy Charts"
Learning & Earning!!
Cheers!!!

something is cooking. this stock is trading at all time high and also volumes have popped up for this breakout.
expecting a rally towards 2500. many more to go.

Breakout In ECLERXBuy ECLERX Cmp - 2147
Add On Dips To 1900
Add More In Panic To 1750
SL - 1580 ( Weekly Closing Basis )
Target - 2700+++

Daily Falg Pattern BO in Eclerx ServicesIntroduction:
eClerx was founded in 2000 by Anjan Malik and PD Mundhra with the goal of transitioning, managing and transforming complex business processes. Following successful careers in investment banking, Anjan and PD, graduates of University of Pennsylvania’s Wharton School of Business, jointly identified significant opportunities for providing innovative services and solutions to large global companies undergoing rapid business transformation challenged by legacy systems, new technology, data inaccuracies, and ever-changing processes and workflows. Created from humble beginnings in a small office in Mumbai, today eClerx employs 15,000+ people across Australia, Canada, Germany, India, Italy, Netherlands, Philippines, Singapore, Thailand, UK, and the USA.
Analysis
A Bullish Flag and Pole pattern is visible on the Daily chart of NSE:ECLERX . The Flag and Pole pattern is a bullish continuation pattern and it is visible in charts after a meaningful appreciation in the price.
MACD gave Positive crossover on Daily, Weekly and Monthly chart. So, expecting the momentum to continue.
Fresh position not recomended but if any one holding, then 2950 is immidiate possible target
Risk Disclaimer:
The trading ideas and analyses presented here are for educational purposes only and do not constitute financial advice. Trading and investing in financial markets involve risk. You should carefully consider your own financial situation, risk tolerance, and investment objectives before making any investment decisions.
The information provided in this analysis is based on my personal interpretation of market conditions and the available data at the time of writing. It is subject to change without notice, and I cannot guarantee the accuracy, completeness, or timeliness of the information provided.
Trading and investing carry the risk of substantial losses, and past performance is not indicative of future results. Always be aware that markets can be unpredictable, and prices may move against your trade or investment.
It is advisable to seek advice from a qualified financial professional and to conduct your own research before making any investment decisions. You should only invest funds that you can afford to lose.
I am not responsible for any trades or investments made based on the information presented in this analysis. By reading and using this information, you acknowledge and accept that you are solely responsible for any losses you may incur.

ECLERX | Multiyear Breakout | InvestAll information given is only for educational purposes. I am not a SEBI Registered analyst. Please consult your financial advisor before investing.

BUY TODAY SELL TOMORROW for 5% DON’T HAVE TIME TO MANAGE YOUR TRADES?
- Take BTST trades at 3:25 pm every day
- Try to exit by taking 4-7% profit of each trade
- SL can also be maintained as closing below the low of the breakout candle
Now, why do I prefer BTST over swing trades? The primary reason is that I have observed that 90% of the stocks give most of the movement in just 1-2 days and the rest of the time they either consolidate or fall
Trendline Breakout in ECLERX
BUY TODAY SELL TOMORROW for 5%
