#Eicher Motorsplease refer to the chart.
Gratify if you appreciate the practice then you can like it, share it and
If you want me to investigate any chart for you then would cherish doing that for you.
Thank you for your time and support.
Stay safe.
EICHERMOT trade ideas

A Leading Diagonal in Eicher Motors. Near an interesting pointNSE:EICHERMOT
- Eicher Motors chart is forming a Leading Diagonal Elliot wave structure. A Leading Diagonal is a transitional structure (correction to impulse) forming as part of the first wave of a larger impulse degree.
- The first wave leading diagonals form as a 5-3-5-3-5 overlapping structure as shown on the chart.
- There is no doubt this counter is bullish in the next coming months but it has now reached into the 5th wave of its 1st impulse structure. Contextually we should see a strong correction for targets as marked on the charts with ABC pathway of correction.
- The ideal levels of shorting can be at 2900 and above . Note that there can be an overthrow beyond the trendline connecting impulse 1 and 3 due to a fake-out. The daily RSI already shows divergence.
It will form a beautiful RISK:REWARD for shorting from the price mentioned. Advice to take trade based on your own risk management rules. Let me know your thoughts in the comment section.

Eicher Motors: Towards New 52W HighEicher Motors: Weekly Chart
1. On the verge of B/O. New 52W high in view. Buy dips.

Eicher Motor Long Eicher Motor Given a Strong Trendline Breakout With Retest and Also Engulfing the Previous Day Candle...
LTP ::3080 Buy Near 3080-3090 SL 2900 Target 3400-3500
Duration Around 1 Months
Auto Sector Looking Strong ..
Just a Study Related Call ..
Do take your Own Decision before taking any trades.....


Eicher motor 3050 to buyBuy eicher motor above 3050, and hold for long term target 3600, short term 3100,
You may keep your eyes on this auto stock.

Eicher motorsE motors trying to break weakly resistance level expect good moment after break.do follow more updates
5 Years Multiyear Breakout in EICHERMOT5 Years #Multiyear #Breakout in #EICHERMOT (Eicher Motors Ltd). #EICHERMOT is #Outperformed #Nifty in current scenario.
BSE: 505200 / NSE : EICHERMOT
What Is a Double Bottom?
A #doublebottom #pattern is a #technical #analysis #charting pattern that describes a change in trend and a momentum reversal from prior leading price action. It describes the drop of a stock or index, a rebound, another drop to the same or similar level as the original drop, and finally another rebound. The double bottom looks like the letter "W". The twice-touched low is considered a support level.
ONLY FOR #educational
NOT SEBI REGISTERED. #LEARNEARN (DONT TRUST ANYONE)
#nifty50 #sharemarket #BREAKOUTSTOCKS #Multibagger #sharemarket #sharemarketindia #sensex #technicalanalysis #kukiinvest #Chartanalysis #headandshoulders #doubletop #doublebottom #parallelchannel #relativestrength
DISCLAIMER: I am not SEBI registered analyst. All posts are for educational purpose only. I am not responsible for your any loss or profit. Consult your adviser before taking any trade. I help people to learn technical analysis & charts reading.

Eicher Motors - Shorting opportunity Focus on Eicher motors, it formed a bearish piercing line candle stick pattern, seems like bull run is complete (profit bookings happened)
Shorting opportunity for time being and go long once takes support on 28% of fib or short till 38% and go long after taking support at 38% of fib

EICHERMOT Ascending triangle !!NSE:EICHERMOT
#EICHERMOT formed beautiful Ascending triangle !!
Happy LEarning.

EICHERMOTORSAs we can see Eichermotors is near yearly supply, so we can take small risk and short for decent rewards. Short near 2950-3000, sl of 3000. Target could be 2800-2600, if everything goes good.

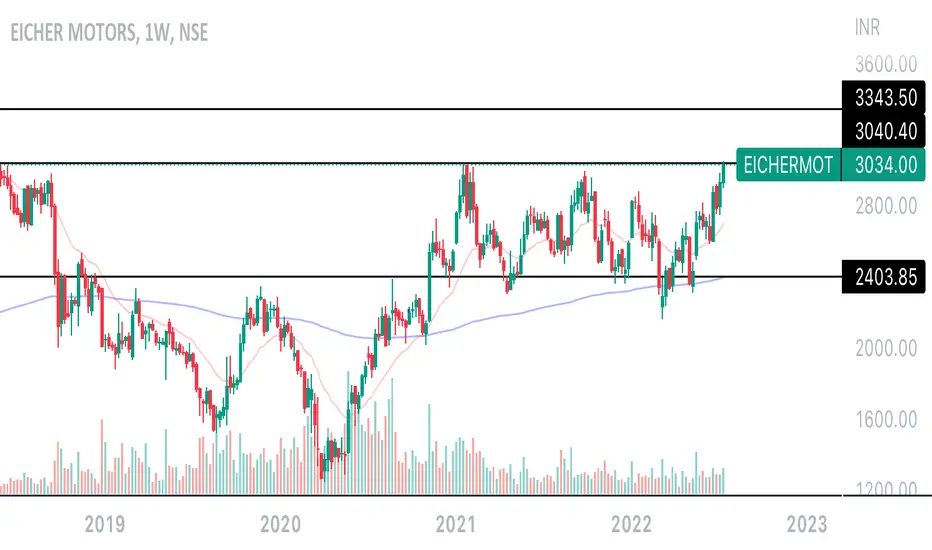
EICHER - Strong long above 2930 levelsEICHER MOTORS - After a huge consolidation of 1.5 yrs in the range of 2300 to 2950, Eicher is about to give a brk out above 2930 levels. Strong upside potential seen in this post breakout. Positional Target 3500.

EICHER MOTORS - 6th July 2022Stock hitting Resisitance Zone 3000-2800.
Bears will try to dominate from here in pushing prices lower.

Breakout on Daily ChartEicher Motors had a breakout on the daily chart as shown above. For new entry for long position, wait for retracement and enter for good upmove.

Eicher motors breaking out ?Eicher motors is showing great sign sign of bullishness in much macroeconomic conditions it is about to break multi month symmetrical triangle if it closes above the trendline with high volumes we can initiate a long trade with strict SL. We can look around for 16% to the upside after this breakout , so it can be a great swing trade. NOT FA

Eicher Motor Ichimoku Bullish Breakout Stock Name - Eicher Motors
Ichimoku Cloud Setup :
1). Today's close is above the Conversion Line
2). Future Kumo is Bullish
3). Chikou span is slanting upwards
All these parameters are showing bullishness and
More strength will be visible above 2830
#This is not Buy and Sell recommendation to any one. This is for education purpose and a helping hand to learn trading in Market.
# Rule Based Investing
# Ichimoku Cloud
# Ichimoku Followers
I hope you all like my analysis.
Please do share your thoughts into comment section.
Please give a like, it motivates me to do analysis.

EICHERMOT !NSE:EICHERMOT
One Can Go long with a Strict SL below the Trendline or Swing Low of Daily Candle.
Close is good, and Clean.
R:R ratio is 1 :2 .
Disclaimer : You are responsible for your Profits and loss, Shared for Educational purpose.

Big Big HnSOn weekly timeframe a Head and shoulder formation is taking its shape, formation completes above 2990, one its closes and holds above 3000, long position can be initiated for at least target of 4800 in next one year.

Shorting Opportunity This scrip is expected to leads breakdowm in the coming days. So traders keep on your radar to catch the momentum. Thanks to all 🙏🙏🙏

LONG in eichermotA LONG SWING TRADE TF+1(DAILY), TF(75MIN)
IN DAILY TIME FRAME STOCK HAS Start PICKING SOME Momentum
WITH RISING AO AND MACD Divergence
IN 75MIN TIME FRAME
RSI (3PERIOD) IS @OVEROLD
AND Stochastic Oscillator Divergence CAN BE SEEN WITH RISING LEEN

Eicher Motor: Short Swing trade All levels are mentioned on the chart.
Please follow chart guidelines.
DISC: Please consult your advisor before making any financial decision.

Simple Trade Setup | EICHER MOTOR | 30-05-2022 [INTRADAY]NSE:EICHERMOT
Observations:
1) On 1 week time frame, it has come above the resistance channel and closed above it.
Please refer below chart : 1 week time frame.
Now make or break range is 2780-2800 range.
Sustainable breakout of this range will give good up move an if it fail to do it then it can come down to retest again this resistance channel.
So keep this stock on radar through out next week.
2) Below is the same chart but on 1 day time frame.
Please refer below chart : 1 day time frame.
-------------------------------------
Trade Setup for 30-05-2022
1) Don't Jump in to trade at the beginning of the market. Let it get settle for 15-20min first and judge the price action.
2) Everything is mentioned on the chart. I hope it is easy to understand.
3) All the levels will work as support, resistance, entry and exit w.r.t price action near that level.
4) Avoid gap up or gap down chase. Wait and trade between levels.
Please refer below chart for levels.
Hope I made it easy to understand it.
Do comment your doubt or suggestion.
Note: Trade with Strict SL. It may or may not hit all the levels. So one can book profit / loss at respective level considering how price action works near that level.

Buy Today, Sell Tomorrow: EICHERMOTDON'T HAVE TIME TO MANAGE YOUR TRADES?
- Take BTST trades at 3:25 pm every day
- Book profits within the first 30 minutes of the market opening
- Try to exit by taking 3-5% profit of each trade
- SL can be taken when the 5/15 min candle closes below 44EMA
- SL can also be maintained as 1% or closing below the low of the breakout candle
The levels mentioned on the chart are calculated using the BREAKOUT INDICATOR
Now, why do I prefer BTST over swing trades? The primary reason is that I have observed that 90% of the stocks give most of the movement in just 1-2 days and the rest of the time they either consolidate or fall
Trendline Breakout in EICHERMOT
Buy Today, Sell Tomorrow: EICHERMOT
