ERIS ifesciences 1d timeframeEris has given a beautiful breakout and a perfect retest, the volumes look strong. I would definitely go long for a target of 800 plus.
Trade wisely.
disclaimer, this is just for educational purposes.
ERIS trade ideas


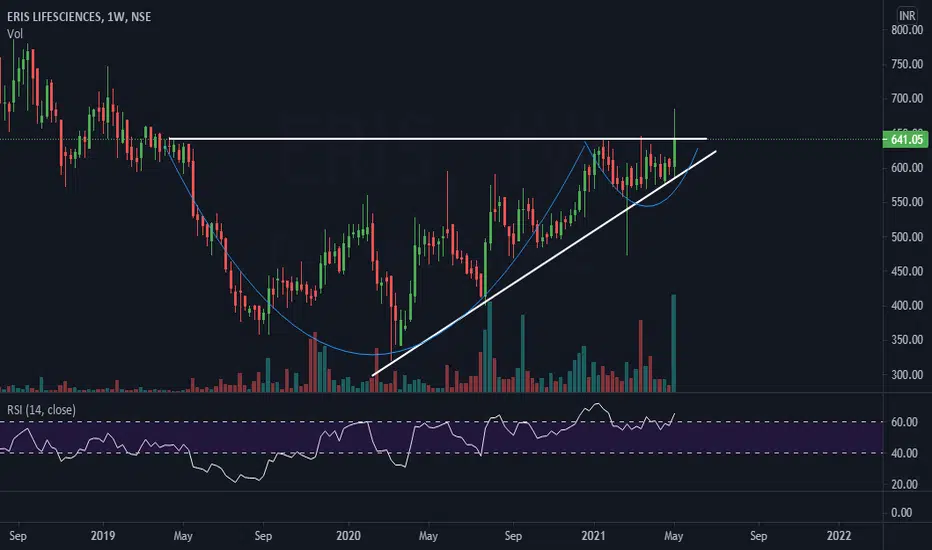
ERIS LIFE SCIENCES - WEEKLY CHARTVolume Breakout
Two Bullish Pattern - Rounding Bottom and Cup with Handle


ERIS. Risk to reward 1:5. Risk 3.8% Profit 19.2%Eris has a beautiful set up.
Breaking Ascending triangle pattern.
> We can wait for price to come at the retest level, as everything is mentioned in the chart.
>we will only enter when Risk to Reward is in our favour.
>Dont just predict ,enter when there is a solid reason to enter.
Best of luck everyone.
Hope everyone makes smart money.


eris lifesciencesstock has given breakout in cup and handle pattern with strong volume and now stock can move towards 746/812 levels in coming days with the help of 595 support level on chart.

ERIS ConsolidationIt has been consolidating on 15 min time frame, closed near to previous high closes on daily time fame.
RSI above 60 on daily chart.
expecting consolidation breakout ahead.

Watchout for Resistance breakout (INTRADAY IDEA)The stock has been consolidating in a range for last few days and looks good for further upmove above 685 level.

ERIS Lifesciences 15m time frameERIS life sciences has formed a bullish flag, If you have seen my previous analysis this is a continuation. I am still bullish on this particular one. But wait for a good confirmation before you enter, or a rejection per say.

Eris Lifescience 1h time frameERIS has been consolidating in a perfectly symmetrical circle, and if you look closely the triangle forms somewhat a flag. I suppose it should go up, wait for a breakout and a retest.
Trade wisely...

Reverse H&D in ERIS LIFESCIENCELong term reverse H&S formation completed in ERIS LIFE SCIENCE. Breakout of neckline is confirmed with increased volume. Potential 200 points upside. CMP 576.10. Support zone 570-550. SL 520. Long term investment.


ERISPositional Pick - Cup and handle breakout + Good buying volumes. ~570 level acting as good support, created a range around that levels now moving up.
ERIS LONG VIEWERIS LIFE SCIENCES: ROUNDING BOTTOM, GOOD DATA AND BIG PLAYER"S AVERAGING POSITION.
BUY ERIS at 641 SL: 550 TARGETS: 700/750/775 6 days to 45 days view

Multi Year Breakout - Rounding Bottom PatternEris Lifesciences is involved in the business activities of Manufacture of pharmaceuticals, medicinal chemical and botanical products.
The Stock Broke out of a multi year breakout with good volume. RSI is at perfect levels. The stock is bouncing after taking support at 50 & 100 DMA both at the same place.
The Company is performing good continuously. An annual revenue growth of 7% is good & ROE of 22% is exceptional. The Company is Debt Free and has strong Balance Sheet. It has potential to post good numbers in coming years as well. EPS of the Company has consistently improved. FPI have also improved their stake in the company from 10.11% in June, 2020 to 12.42% in March 2021.
Accumulate for Targets of 700-760 with SL at 580. Long Term Target 850.
Please feel free to share your feedback and queries.

Dravas Box BOThe stock gave a BO yesterday and retraced back. Looks good positionally above 646.25 level for 7-8% upmove


Eris Life Science Stock looks good for 1000 in next 6-12 months .. can be added at cmp and on dips to 550 for medium to long term

ERIS symmetrical TriangleERIS has been consolidating for a quite long time.
RSI is hovering just below 60 on daily chart.
Narrow CPR on daily chart.

ERIS Rally Aheadif it closes above 607-608 levels on daily chart. we can see a rally from here on.
it is about to break to recent swings of RSI.
Narrow CPR on daily chart
looks like MACD cross over today
ADX Cross over

