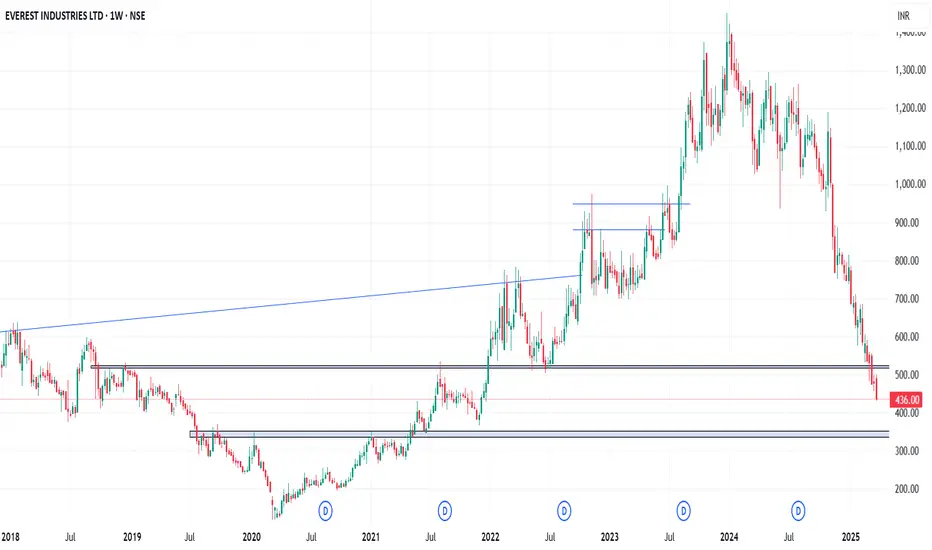
EVERESTIND - Weekly AnalysisIn the Weekly Chart of EVERESTIND ,
we can see that; selling is very strong.
It is leading it towards Strong support of 345-350.
If we see a Pinbar or W pattern recovery, we can have a Long term entry.
−11.30 INR
−36.04 M INR
17.22 B INR
5.03 M
About Everest Industries Limited
Sector
Industry
CEO
Hemant Khurana
Website
Headquarters
Mumbai
Founded
1934
ISIN
INE295A01018
FIGI
BBG000CR3743
Everest Industries Ltd. engages in the provision of building solutions. It operates through the Building Products and Steel Building segments. The Building Products segment includes manufacturing and trading of roofing products, boards and panels, other building products and accessories. The Steel Building segment consists of manufacture and erection of pre-engineered and smart steel buildings and its accessories. The company was founded on April 3, 1934 and is headquartered in Mumbai, India.
Related stocks
Everest Industries - Bullish - Buy at Demand ZoneWait for the stock to reach the demand zone. Looking good around 588 should achieve targets 1 and targets 2 in 2 quarters, Be Patient

EVERESTIND - Stock in RADARStock Price consolidata since September 2023 in 1000 Range and it seems ready to breakout. It forms good structure in Day Timeframe and morning star like structure in Weekly Timeframe.

Everest industries-Good reversal trade!Everest industries is looking good as a reversal trade as a swing trade.
Stock is bouncing from confluence of supports.If bullish trend continues, we can see targets soon. RSI divergence is also seen during the bounce.

EVERESTIND's Recent Breakout - A Dive into the Technical📈 EVERESTIND's Breakout Analysis 📉
Hello, fellow traders! Today, we're diving deep into EVERESTIND's breakout that occurred on 7th August 2023, shortly after the company announced impressive financial results. The stock has shown some intriguing patterns, and I'm here to break it all down for you,

#EVERESTINDNSE:EVERESTIND
Day closing above 970 can see upside.
Support around 870-875.
ATH BreakOut.


BREAKOUT, EVEREST INDUSTRIES, 50% RETURNS!!!BUY - EVEREST INDUSTRIES
CMP - Rs. 929
Target - 1: Rs. 1158
Target - 2: Rs. 1390
.
.
Technicals - Trendline Breakout
.
This is just a view by an expert analyst, please invest at your own risk.
.
Follow me for more!

Triangle pattern breakout set up1. Breakout on daily TF
2. Weekly breakout to watch for to go for short term investing
3.RR is very lucrative with pyramiding perspective from 1:5 or 1:10 RR

#Everest Industries Analysis Stock has given BO on daily chart with good volume spike maintaining supportive trendline, follow chart for support and resistance levels.

See all ideas
Summarizing what the indicators are suggesting.
Oscillators
Neutral
SellBuy
Strong sellStrong buy
Strong sellSellNeutralBuyStrong buy
Oscillators
Neutral
SellBuy
Strong sellStrong buy
Strong sellSellNeutralBuyStrong buy
Summary
Neutral
SellBuy
Strong sellStrong buy
Strong sellSellNeutralBuyStrong buy
Summary
Neutral
SellBuy
Strong sellStrong buy
Strong sellSellNeutralBuyStrong buy
Summary
Neutral
SellBuy
Strong sellStrong buy
Strong sellSellNeutralBuyStrong buy
Moving Averages
Neutral
SellBuy
Strong sellStrong buy
Strong sellSellNeutralBuyStrong buy
Moving Averages
Neutral
SellBuy
Strong sellStrong buy
Strong sellSellNeutralBuyStrong buy
Displays a symbol's price movements over previous years to identify recurring trends.
Frequently Asked Questions
The current price of EVERESTIND is 714.80 INR — it has increased by 4.60% in the past 24 hours. Watch Everest Industries Limited stock price performance more closely on the chart.
Depending on the exchange, the stock ticker may vary. For instance, on NSE exchange Everest Industries Limited stocks are traded under the ticker EVERESTIND.
EVERESTIND stock has fallen by −0.38% compared to the previous week, the month change is a 7.17% rise, over the last year Everest Industries Limited has showed a −31.48% decrease.
EVERESTIND reached its all-time high on Dec 29, 2023 with the price of 1,450.95 INR, and its all-time low was 42.10 INR and was reached on Feb 27, 2009. View more price dynamics on EVERESTIND chart.
See other stocks reaching their highest and lowest prices.
See other stocks reaching their highest and lowest prices.
EVERESTIND stock is 6.34% volatile and has beta coefficient of 0.96. Track Everest Industries Limited stock price on the chart and check out the list of the most volatile stocks — is Everest Industries Limited there?
Today Everest Industries Limited has the market capitalization of 11.32 B, it has decreased by −6.23% over the last week.
Yes, you can track Everest Industries Limited financials in yearly and quarterly reports right on TradingView.
EVERESTIND net income for the last quarter is 16.35 M INR, while the quarter before that showed 76.39 M INR of net income which accounts for −78.60% change. Track more Everest Industries Limited financial stats to get the full picture.
Yes, EVERESTIND dividends are paid annually. The last dividend per share was 2.50 INR. As of today, Dividend Yield (TTM)% is 0.35%. Tracking Everest Industries Limited dividends might help you take more informed decisions.
As of Oct 5, 2025, the company has 5.86 K employees. See our rating of the largest employees — is Everest Industries Limited on this list?
EBITDA measures a company's operating performance, its growth signifies an improvement in the efficiency of a company. Everest Industries Limited EBITDA is 194.45 M INR, and current EBITDA margin is 1.77%. See more stats in Everest Industries Limited financial statements.
Like other stocks, EVERESTIND shares are traded on stock exchanges, e.g. Nasdaq, Nyse, Euronext, and the easiest way to buy them is through an online stock broker. To do this, you need to open an account and follow a broker's procedures, then start trading. You can trade Everest Industries Limited stock right from TradingView charts — choose your broker and connect to your account.
Investing in stocks requires a comprehensive research: you should carefully study all the available data, e.g. company's financials, related news, and its technical analysis. So Everest Industries Limited technincal analysis shows the strong buy rating today, and its 1 week rating is buy. Since market conditions are prone to changes, it's worth looking a bit further into the future — according to the 1 month rating Everest Industries Limited stock shows the neutral signal. See more of Everest Industries Limited technicals for a more comprehensive analysis.
If you're still not sure, try looking for inspiration in our curated watchlists.
If you're still not sure, try looking for inspiration in our curated watchlists.