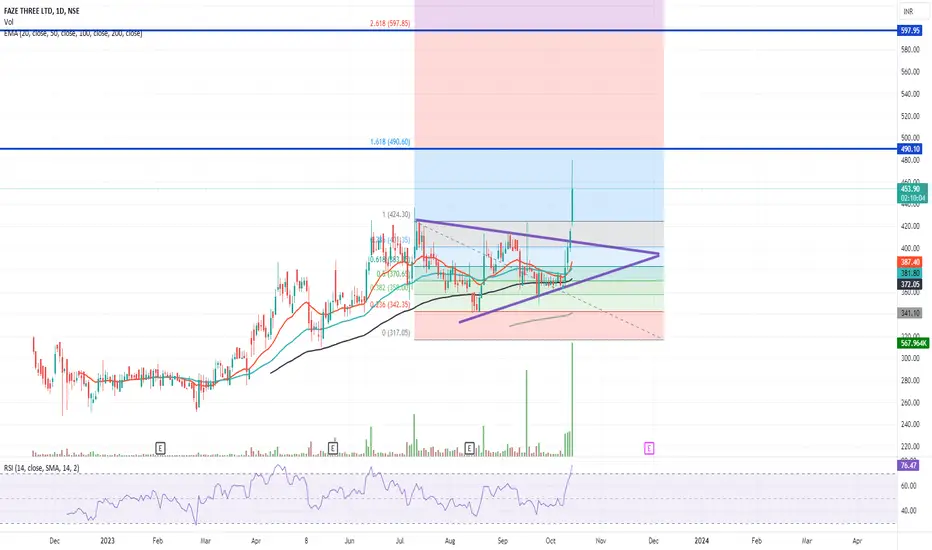
FAZE3Q | BUY1) FAZE3Q shows strong uptrend potential with good technical and fundamental looks strong
2) Textile sector was underperforming for the past few years, we can expect a demand from this point, this makes the sector looks attractive
3) FII's have started entering into the stock which looks promising
Next report date
—
Report period
—
EPS estimate
—
Revenue estimate
—
14.80 INR
465.90 M INR
5.39 B INR
4.63 M
About FAZE THREE LTD
Sector
Industry
CEO
Ajay Brijlal Anand
Website
Headquarters
Mumbai
Founded
1982
ISIN
INE963C01033
FIGI
BBG000F66YD4
Faze Three Ltd. engages in the manufacture and exportation of home textiles, cotton handlooms, furnishing fabrics, and textile made-ups. Its products include cotton, rubber backed, and tufted bathmats; durries; bed spreads and throws; quilts and baby blankets; hand tufted rugs and mats made of cotton, cushion, and cushion covers; and theme based shower curtains. The company was founded by Ajay Brijlal Anand and Sanjay Brijlal Anand in 1982 and is headquartered in Mumbai, India.

FAZE3Q- Self Analysis 3 CurvesFAZE3Q- Self Analysis 3 Curves
1) 3 Ascending Curves
2) Price Boundation in Channel
3) Good Entry with Low risk

FAZE THREE LTD - BOTTOM TRIANGLE & BULLISH WEDGE"Bottom Triangle" chart pattern formed on Faze Three Ltd ( NSE:FAZE3Q ). This bullish signal indicates that the stock price may rise from the close of 477.80 to the range of 507.00 - 520.00.
The price seems to have reached a bottom, showing signs of reversal as it has broken upward after a period

# FAZE3Q # NSE - DAY TRADE/ BTST IDEAFAZE THREE - CHANNEL breakout in 15 min TF.
Disclaimer:
For educational purpose only.
Please do your own research before taking any trades.
Happy Trading!

Retest done📌Keep on Radar
FAZE3Q
+ Volume & Volatility contracting
+ Nice Volume Buildup
+ Trading above Key EMAs
+ Retest done

#FAZE 3 #NSE - CHANNEL PATTERNFAZE 3 - Inside a CHANNEL pattern. Breakout possibility.
Disclaimer:
For educational purpose only.
Please do your own research before taking any trades.
Happy Trading!

#FAZE THREE #NSE - BTST IDEAFAZE THREE - A CUP pattern formed in 15min TF.
Disclaimer:
For educational purpose only.
Please do your own research before taking any trades.
Happy Trading!

FAZE3 Excellent Breakout..
Position at 400 Rs.
490-590 seems possible easily..
The best part of this breakout.. Volumes !!! Humongous volumes today ..
Invested on last week of August i guess..
Patience kept is being rewarded
FAZE3Q | Cup & Handle + Trendline breakout - Potential for 30%FAZE3Q | Cup & Handle + Trendline breakout - Potential for 30%
CMP : 415
SL : 385

Faze Three LtdCompany has delivered good profit growth of 27.8% CAGR over last 5 years.
Looking good on charts. Company is reporting all time high profits.

See all ideas
Displays a symbol's price movements over previous years to identify recurring trends.
Frequently Asked Questions
The current price of FAZE3Q is 435.10 INR — it has increased by 1.85% in the past 24 hours. Watch FAZE THREE LTD stock price performance more closely on the chart.
Depending on the exchange, the stock ticker may vary. For instance, on NSE exchange FAZE THREE LTD stocks are traded under the ticker FAZE3Q.
FAZE3Q stock has risen by 5.01% compared to the previous week, the month change is a 11.79% rise, over the last year FAZE THREE LTD has showed a −2.62% decrease.
FAZE3Q reached its all-time high on Aug 13, 2024 with the price of 584.40 INR, and its all-time low was 247.80 INR and was reached on Dec 6, 2022. View more price dynamics on FAZE3Q chart.
See other stocks reaching their highest and lowest prices.
See other stocks reaching their highest and lowest prices.
FAZE3Q stock is 7.23% volatile and has beta coefficient of 0.81. Track FAZE THREE LTD stock price on the chart and check out the list of the most volatile stocks — is FAZE THREE LTD there?
Today FAZE THREE LTD has the market capitalization of 10.86 B, it has increased by 5.49% over the last week.
Yes, you can track FAZE THREE LTD financials in yearly and quarterly reports right on TradingView.
FAZE THREE LTD is going to release the next earnings report on Jan 31, 2025. Keep track of upcoming events with our Earnings Calendar.
FAZE3Q net income for the last quarter is 71.00 M INR, while the quarter before that showed 72.60 M INR of net income which accounts for −2.20% change. Track more FAZE THREE LTD financial stats to get the full picture.
FAZE THREE LTD dividend yield was 0.00% in 2023, and payout ratio reached 0.00%. The year before the numbers were 0.16% and 2.09% correspondingly. See high-dividend stocks and find more opportunities for your portfolio.
As of Dec 12, 2024, the company has 3.08 K employees. See our rating of the largest employees — is FAZE THREE LTD on this list?
EBITDA measures a company's operating performance, its growth signifies an improvement in the efficiency of a company. FAZE THREE LTD EBITDA is 758.40 M INR, and current EBITDA margin is 18.83%. See more stats in FAZE THREE LTD financial statements.
Like other stocks, FAZE3Q shares are traded on stock exchanges, e.g. Nasdaq, Nyse, Euronext, and the easiest way to buy them is through an online stock broker. To do this, you need to open an account and follow a broker's procedures, then start trading. You can trade FAZE THREE LTD stock right from TradingView charts — choose your broker and connect to your account.
Investing in stocks requires a comprehensive research: you should carefully study all the available data, e.g. company's financials, related news, and its technical analysis. So FAZE THREE LTD technincal analysis shows the neutral today, and its 1 week rating is neutral. Since market conditions are prone to changes, it's worth looking a bit further into the future — according to the 1 month rating FAZE THREE LTD stock shows the buy signal. See more of FAZE THREE LTD technicals for a more comprehensive analysis.
If you're still not sure, try looking for inspiration in our curated watchlists.
If you're still not sure, try looking for inspiration in our curated watchlists.