FINPIPE 1 Month Time Frame📊 Current Context
The share has been moderately positive over the past month (~+5–8% gains) in recent price data.
Recent share price (late Jan 2026) is near ₹175–177 levels.
📈 Key Levels (1‑Month Timeframe)
🔹 Resistance Levels
These are levels where the price may face selling pressure:
1. ~₹177–17
Finolex Industries Limited
No trades
Next report date
—
Report period
—
EPS estimate
—
Revenue estimate
—
8.13 INR
8.00 B INR
41.29 B INR
259.58 M
About Finolex Industries Limited
Sector
Industry
CEO
Udipt Agarwal
Website
Headquarters
Pune
Founded
1981
IPO date
Nov 3, 1994
Identifiers
2
ISIN INE183A01024
Finolex Industries Ltd. engages in the manufacture and sale of polyvinyl chloride (PVC) pipes and fittings. It operates through the PVC, and Pipes and Fittings segment. The PVC segment produces and distributes PVC resin. The Pipes and Fittings segment focuses on the manufacture of pipes and fittings required principally in the agriculture, and construction industries. The company was founded by Prakash Prahlad Chhabria on March 28, 1981 and is headquartered in Pune, India.
Related stocks
finolex pipes looking good to buy.I have bought it and will continue to hold for 50% to 100% gains. i may change my mind also.

Finolex Industries: A Potential Long-Term InvestmentFinolex Industries has recently formed a butterfly pattern in its stock chart and is currently positioned within a strong support zone around ₹200. The stock has experienced a significant decline of approximately 40%, making it potentially attractive for long-term investors.
Fundamental Analysis of

#FINPIPE.. stock shaping well for a move upStock made a good formation at the base SL hunts back in April , followed by a strong move up and retracement . Recent moves showing signs of trend continuation . Keep on radar
Finolex Industries LtdDate 19.04.2025
Finolex Industries
Timeframe : Weekly Chart
Finolex Industries Limited (FIL) is a leading manufacturer of PVC Resin and the largest producer of PVC Pipes & Fittings in India.
Technical Remarks :
1 Broke 4 years long support channel emerged since covid 2020 lows
2 Below 200 we

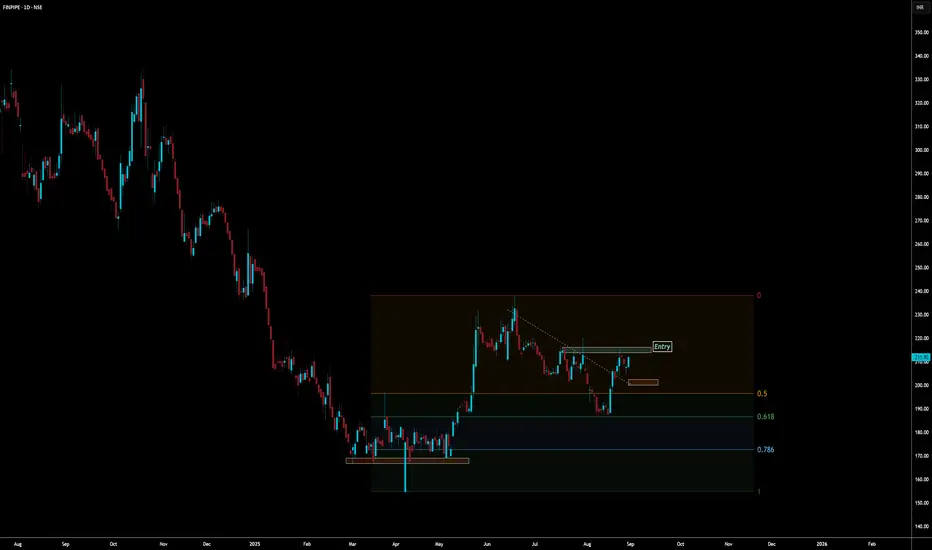
Finolex Industries LTD view based on harmonic patternsMy view on Finolex Industries LTD, as you can see there is nice gartely pattern has been formed , alongwith that it has got support at 0.78% fib level.
Based on FIB level , target is marked and SL is also placed.
So, lets look how it turns.
Thank you.
#finolexindustries #harmonicpatterns #finolex #

Reversal @ FINPIPE
STOCK: Finolex Industries Ltd.
SETUP: The price was facing the same resistance since 2021 ie 245 to 260, and finally gave a break out on March 24, and tested the 350 level, price again at the same break out restest level, and Bullish RSI divergence is visible can reverse from the same level to

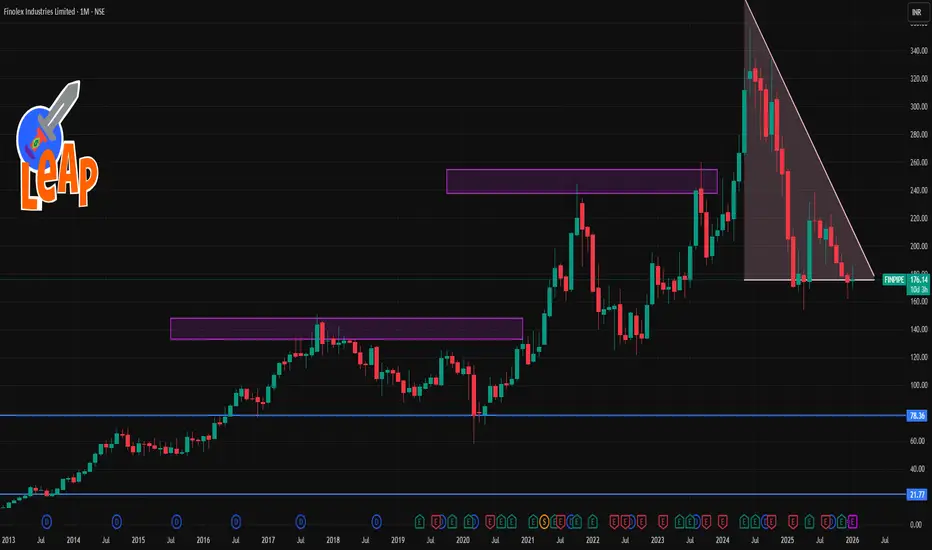
Finolex Pipes - Falling Wedge Finolex Pipe has created Falling Wedge pattern, it has minimal volumes in this fall from 340 level.
Breakout zone is above 250 level.
Buy @ 240 level
SL 225
Target of the pattern is 340-350 level.
Time Frame : Short Term.

FINPIPE Trading Within Fresh Demand ZoneFINPIPE is currently trading at ₹255.7, positioned within its demand zone between ₹257.7 and ₹251.3, identified on 24th April 2024. This fresh zone remains untested, suggesting potential buying interest if the stock price consolidates within this range. Investors may watch for signs of support, whic

Finolex could not sustain the breakout, whats next?Failed breakout means buyers trapped.
It tried to bounce back but failed again.
The stock may soon touch 245 levels.
Observations from the Chart:
* Downward Trend: The overall trend of the stock appears to be downward, as indicated by the descending channel formation.
* Failed Breakout: The stoc

See all ideas
Summarizing what the indicators are suggesting.
Neutral
SellBuy
Strong sellStrong buy
Strong sellSellNeutralBuyStrong buy
Neutral
SellBuy
Strong sellStrong buy
Strong sellSellNeutralBuyStrong buy
Neutral
SellBuy
Strong sellStrong buy
Strong sellSellNeutralBuyStrong buy
An aggregate view of professional's ratings.
Neutral
SellBuy
Strong sellStrong buy
Strong sellSellNeutralBuyStrong buy
Neutral
SellBuy
Strong sellStrong buy
Strong sellSellNeutralBuyStrong buy
Neutral
SellBuy
Strong sellStrong buy
Strong sellSellNeutralBuyStrong buy
Displays a symbol's price movements over previous years to identify recurring trends.
MOSMALL250
Motilal Oswal Nifty Smallcap 250 ETF Units Exchange Traded FundWeight
0.24%
Market value
39.07 K
USD
HESC
HSBC ETFs PLC - HSBC MSCI Emerging Markets Small Cap Screened UCITS ETFWeight
0.03%
Market value
15.80 K
USD
Explore more ETFs
Frequently Asked Questions
The current price of FINPIPE is 179.00 INR — it has increased by 3.87% in the past 24 hours. Watch Finolex Industries Limited stock price performance more closely on the chart.
Depending on the exchange, the stock ticker may vary. For instance, on NSE exchange Finolex Industries Limited stocks are traded under the ticker FINPIPE.
FINPIPE stock has risen by 2.84% compared to the previous week, the month change is a 2.99% rise, over the last year Finolex Industries Limited has showed a −10.50% decrease.
We've gathered analysts' opinions on Finolex Industries Limited future price: according to them, FINPIPE price has a max estimate of 244.00 INR and a min estimate of 168.00 INR. Watch FINPIPE chart and read a more detailed Finolex Industries Limited stock forecast: see what analysts think of Finolex Industries Limited and suggest that you do with its stocks.
FINPIPE reached its all-time high on Jun 7, 2024 with the price of 355.90 INR, and its all-time low was 1.35 INR and was reached on Jan 13, 1999. View more price dynamics on FINPIPE chart.
See other stocks reaching their highest and lowest prices.
See other stocks reaching their highest and lowest prices.
FINPIPE stock is 0.18% volatile and has beta coefficient of 0.94. Track Finolex Industries Limited stock price on the chart and check out the list of the most volatile stocks — is Finolex Industries Limited there?
Today Finolex Industries Limited has the market capitalization of 106.69 B, it has decreased by −1.55% over the last week.
Yes, you can track Finolex Industries Limited financials in yearly and quarterly reports right on TradingView.
Finolex Industries Limited is going to release the next earnings report on May 27, 2026. Keep track of upcoming events with our Earnings Calendar.
FINPIPE earnings for the last quarter are 1.90 INR per share, whereas the estimation was 1.77 INR resulting in a 7.55% surprise. The estimated earnings for the next quarter are 2.40 INR per share. See more details about Finolex Industries Limited earnings.
Finolex Industries Limited revenue for the last quarter amounts to 8.98 B INR, despite the estimated figure of 10.35 B INR. In the next quarter, revenue is expected to reach 12.90 B INR.
FINPIPE net income for the last quarter is 1.16 B INR, while the quarter before that showed 1.24 B INR of net income which accounts for −6.05% change. Track more Finolex Industries Limited financial stats to get the full picture.
Finolex Industries Limited dividend yield was 1.11% in 2024, and payout ratio reached 15.46%. The year before the numbers were 1.01% and 32.64% correspondingly. See high-dividend stocks and find more opportunities for your portfolio.
As of Feb 10, 2026, the company has 4.41 K employees. See our rating of the largest employees — is Finolex Industries Limited on this list?
EBITDA measures a company's operating performance, its growth signifies an improvement in the efficiency of a company. Finolex Industries Limited EBITDA is 5.18 B INR, and current EBITDA margin is 12.23%. See more stats in Finolex Industries Limited financial statements.
Like other stocks, FINPIPE shares are traded on stock exchanges, e.g. Nasdaq, Nyse, Euronext, and the easiest way to buy them is through an online stock broker. To do this, you need to open an account and follow a broker's procedures, then start trading. You can trade Finolex Industries Limited stock right from TradingView charts — choose your broker and connect to your account.
Investing in stocks requires a comprehensive research: you should carefully study all the available data, e.g. company's financials, related news, and its technical analysis. So Finolex Industries Limited technincal analysis shows the buy rating today, and its 1 week rating is sell. Since market conditions are prone to changes, it's worth looking a bit further into the future — according to the 1 month rating Finolex Industries Limited stock shows the neutral signal. See more of Finolex Industries Limited technicals for a more comprehensive analysis.
If you're still not sure, try looking for inspiration in our curated watchlists.
If you're still not sure, try looking for inspiration in our curated watchlists.