GAEL - Price near Major Support lineThe price has been consolidating since 2022 and is currently trading near a key support level around the 110 range. Previous pullbacks near this support level, as indicated by the green arrows, have shown significant reversals. Currently, a morning star candlestick pattern is forming near the support zone, suggesting potential bullish momentum. However, confirmation of the pullback will require waiting until this weekend's close.
GAEL trade ideas

High conviction stock - GAELCheck this stock which has made an all time low and high chances that it makes a "V" shaped recovery.
> Taking support at last years support or breakout level
> High chances that it reverses from this point.
> Volume dried up badly in last few months / days.
> Very high suspicion based analysis and not based on chart patterns / candle patterns deeply.
DISCLAIMER : This is just for educational purpose. This type of analysis is equivalent to catching a falling knife. If you are a warrior, you throw all the knives back else you will be sorrow if it hits SL. Make sure to do your analysis well. This type of analysis only suits high risks investor and whose is willing to throw all the knives above irrespecitve of any sectoral rotation. BE VERY CAUTIOUS AS IT IS EXTREME BOTTOM FISHING.
HOWEVER, THIS IS HOW MULTIBAGGERS ARE CAUGHT !
STOCK IS AT RIGHT PE / RIGHT EVALUATION / MORE ROAD TO GROW / CORRECTED IV / EXCELLENT BOOKS / USING MARKET CRASH AS AN OPPURTUNITY / EPS AT SKY

Swing - PriceActionCurrently showing strong Support around the Multi-year Trendline, making it a promising Stock for Mid to Long-term holding. Ideal for Swing trading opportunities! Can add now or in dips near 130

Gujarat Ambuja Exports cmp 140.10 by Weekly Chart view*Gujarat Ambuja Exports cmp 140.10 by Weekly Chart view*
- 122 to 125 Support Zone
- Volumes supportive for fresh upside Price momentum trend
- Stock Price upside supportive by the Trendline Bullish Crossover and Support Zone Test Retest
- Weekly basis Support seen at 122 > 98 > 80 with the Resistance at 161 > 179 > 195 > ATH 210.60

GAEL Potential Reversal from Strong Support Zone
✅ The stock is currently trading near a strong trendline support, which aligns with the 200 EMA This combination often indicates a potential reversal zone, as it has historically acted as a significant support level.
✅ The price recently bounced off from around 125 and is now showing signs of strength around 130-135. The upward arrow suggests potential bullish momentum, which could lead to a retest of higher levels.
✅ The stock has been trading within a channel for an extended period, and a move towards the upper boundary of the channel seems likely if the current support holds.
✅ The RSI shows early signs of recovery, indicating that buying interest may be increasing after the recent correction.

Taking support on an important channelThe channel extends several years. If the stock breaks this channel, it may find difficult to come up again.

Diversion RSI in GAELGAEL is at its support zone,
RSI DIVERSION
I will go for buy let see how it goes
This is just for the education purpose
Please do your own research before investing.

GaelGujrat Ambuja Export Ltd
Buy CMP near 145
Add more near 125
Long term Target 200+
This chart is Only for educational purposes

GAEL - Reversal on CARDs. Best above 148GAEL - Stock has shown reversal and gave breakout at 141, with good volumes.
The stock can be added above 148, with strict stop loss of 135.
Promoters / DII / FII's stake has not changed drastically.
Disclaimer : Educational content. Please do your own research.

GAEL - Weekly AnalysisIn the Weekly Chart of GAEL ,
we can see that, it is at decision making point.
Enter on breaking Candle's with Low as SL.
Possible momentums are shown in chart.

GAEL - Weekly AnalysisIn the Weekly Chart of GAEL ,
we can see that, it is at decision making point.
Enter on breaking Candle's with Low as SL.
Possible momentum is shown in chart.

Long on gujarat ambuja Double botttom formed at 1D time frame. Can go long with strict SL
This is for educational purposes only, trade at your own risk.

GAEL - Swing Trade Analysis - 3rd April #stocksGAEL (1W TF) - Swing Trade Analysis given on 3rd April, 2024
Pattern: REVERSAL AT WEEKLY SUPPORT
- Pullback candle at Weekly Support - Done ✓
- Strong Volume candle at Support - In Progress
- Demand Zone Retest & Consolidation - In Progress

GAEL FORMING CUP AND HANDLE PATTERNThe stock has been forming cup and handle pattern on daily time frame and is near the breakout level , the stock can give breakout tomorrow followed by a long rally , the tagets for the same are 486 and 553 levels

GaelGood Swing Trade
earlier posted when CMP was 315 - Now 359 already
For more info - Visit my profile
Regards,
Naresh G
SEBI Reg. RA
Dont forget to boost if you like the Idea

GAEL - CHANNEL FORMATION GAEL - CHANNEL FORMATION
We can expect good move only when it breaks the resistance and sustain.

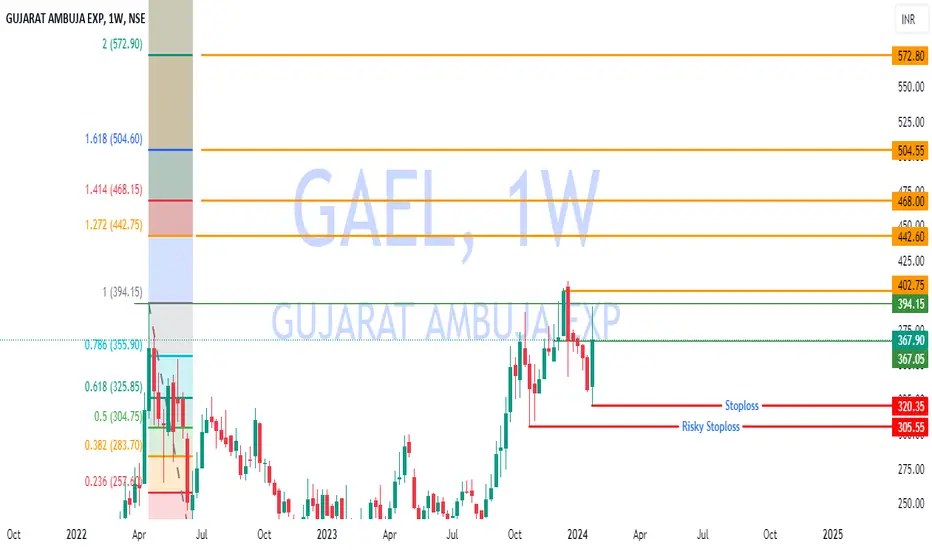
GAEL- Near Multi Year Breakout #GAEL
CMP : 398.3
Date -01-02-2024
Gujarat Ambuja Exports Ltd is an India based company that is principally involved in Agro- processing business.Alow debt company with zero promoter pledge. The company is at the forefront for offering one-stop solutions for ingredients to various food pharmaceuticals and animal nutrition companies. Stock is near its 52 week high. It is heard that company will consider a bonus issue in its next board meeting. Already stock has completed a rounding bottom and also in preparation to complete cup and handle pattern. The news of bonus issue also boosts the share price. Stoploss @ ₹.375 levels.
Disclaimer : Post only for educational purpose. Not a buying / selling recommendation. This is only my personal view. I am not a SEBI registered analyst . Do your own analysis and act accordingly

Gael Better Risk Reward#Gujarat Ambuja Exp is trendy at the moment and Making continuous Higher High and Higher Low,
At the Moment #stock is at Higher Low, followed by #Priceaction.
Buy with the Calculated SL and can Ride the trend.
Safe players can book 1:1.5.
Do your own Analysis before any trade.
#TradewithConviction
Gujarat Ambuja Cup and Handle formationWatching out pullback to 340 or break of All time high for upmove
DISCLAIMER:
There is no guarantee of profits or no exceptions from losses.
The stock and its levels discussed are solely the personal views of my research.
You are advised to rely on your judgment while investing/Trading decisions.
Seek help of your financial advisor before investing/trading.
Investment Warnings:
We would like to draw your attention to the following important investment warnings.
-Investment is subject to market risks.
-The value of shares and investments and the income derived from them can go down as well as up.
-Investors may not get back the amount they invested - losing one's shirt is a real risk.
-Past performance is not a guide to future performance.
-I may or may not trade this analysis
--------------------------(((((LIKE)))))-------------------------------

Symmetrical Triangle pattern Breakout seen in Gujarat AmbujaHello Traders & Investors,
I have brought another analysis on Symmetrical triangle pattern breakout. Well this almost similar to Triangle pattern, but in this lower band trendline act upward sloping support in security. Same we have seen in Gujarat Ambuja Exports. Well there is higher Chances that we can see huge momentum in coming few weeks. So let's go, i will explain a bit about this pattern so you guy's can understand and trade easily whenever you see this pattern next time.
Q:- What is Symmetrical Triangle Pattern?
Rahul:- A symmetrical triangle is a chart formation where the slope of the price’s highs and the slope of the price’s lows converge together to a point where it looks like a triangle.
Q:- Which direction will it go?
Rahul:- If the prior trend is Uptrend then buyers gonna to win the battles for sure.
Q:- How and when to Trade?
Rahul:- Guy's keep in mind when both slopes get closer to each other, it means that a breakout is getting near, and we just have to wait for that breakout to take place. You can take entry once you see successfully breakout and keep stop loss at lower band of the Triangle, and there could be another entry once price shows pull back towards breakout zone. Targets can be place at all time high and 2nd target can be length of Triangle pattern.
So guy's i hope you have learned this Symmetrical Triangle Pattern now.
Let's Focus About Company background:-
Gujarat Ambuja Exports is engaged in the manufacturing of Corn Starch Derivatives, Soya Derivatives, Feed Ingredients, Cotton Yarn, and Edible Oils. Since its incorporation in 1991, GAEL strives to serve the Food, Pharmaceutical, Feed, and many other industries with a long-term growth strategy in the Agro-Processing sector. (Source: Company Website)
Market Cap
₹ 7,223 Cr.
Current Price
₹ 315
High / Low
₹ 327 / 222
Stock P/E
25.2
Book Value
₹ 107
Dividend Yield
0.22 %
ROCE
17.9 %
ROE
14.5 %
Face Value
₹ 1.00
Debt
₹ 227 Cr.
EPS
₹ 12.5
PEG Ratio
1.94
Promoter holding
63.8 %
Intrinsic Value
₹ 170
Pledged percentage
0.00 %
EVEBITDA
14.8
Disclaimer:- Please always do your own analysis or consult with your financial advisor before taking any kind of trades.
Dear traders, If you like my work then do not forget to hit like and follow me, and guy's let me know what do you think about this idea in comment box, i would be love to reply all of you guy's.
Thankyou

Guj Amb ExportsGood volumes for past few weeks and trying to breakout. Can enter around blue line with a target as green and stop loss as red.

GAEL looks goodThe price seems to have reached a bottom, showing signs of reversal as it has broken upward after a period of uncertainty or consolidation.
Diamond pattern has been witnessed in the stock GAEL. The Diamond pattern begins during a downtrend as prices create higher highs and lower lows in a broadening pattern. Then the trading range gradually narrows after the highs peak and the lows start trending upward. When the price breaks upward out of the diamonds boundary lines, it marks a significant reversal to a new uptrend.
Also in this stock witnessed the Double Bottom pattern formation during a downtrend as the price reaches two distinct lows at roughly the same price level. Volume reflects a weakening of the downward pressure, tending to diminish as the pattern forms, with some pickup at each low, less on the second low. Finally the price breaks upward above the highest high to confirm the bullish signal.
Buying area, targets are mentioned in the chart and are self-explainatory.
Note for everyone who came across this study:
This chart is only for educational purpose.
This is not buying or selling recommendations.
I am not SEBI registered.
Please consult your financial advisor before taking any trade.

Gujarat Ambuja Exports Analysis Stock has given BO on daily and weekly chart with good volume build up maintaining supportive Trendline, follow chart for proper support and resistance levels.
