GAIL India Ltd: Assessing Investment Potential Technical Analysis: Butterfly Pattern and Support Levels
GAIL India Ltd has formed a butterfly pattern in its stock chart, currently trading with a 30% decline from its recent highs. The stock is finding support around the ₹170 level, which may present a strategic entry point for long-term investors
Next report date
—
Report period
—
EPS estimate
—
Revenue estimate
—
17.70 INR
124.50 B INR
1.42 T INR
2.70 B
About GAIL (India) Limited
Sector
Industry
CEO
Sandeep Kumar Gupta
Website
Headquarters
New Delhi
Founded
1984
ISIN
INE129A01019
FIGI
BBG000B9Y4Y4
GAIL (India) Ltd. engages in the exploration, production, processing, transmission, distribution, and marketing of natural gas. It operates through the following business segments: Transmission services, Natural Gas Trading or Marketing, Petrochemicals, LPG and Other Liquid Hydrocarbons, and Other. The Transmission services segment includes natural gas and LPG. The Natural Gas Trading or Marketing segment supplies of natural gas include fuel to power plants, feedstock for gas-based fertilizer plants, LPG extraction, and city gas distribution. The Petrochemicals segment manufactures and markets polymers polypropylene, linear low-density polyethylene, and high-density polyethylene from natural gas. The LPG and Other Liquid Hydrocarbons segment sells gas processing unit products such as LPG, propane, pentane, naphtha, and by-products of polymer plant. The Other segment is involved in GAIL TEL, exploration and production, city gas, and power generation. The company was founded in August 1984 and is headquartered in New Delhi, India.
Related stocks

GAIL Bullish way ahead?!!!Chart patterns suggest me the above titled opinion
1. Its is travelling in a Ascending channel pattern making Higher highs and higher lows .
2. Now it is at the bottom support loading for the explosive move ahead.
3. Let's wait for the Breakout and enter.
Target levels mentioned in chart...SL u

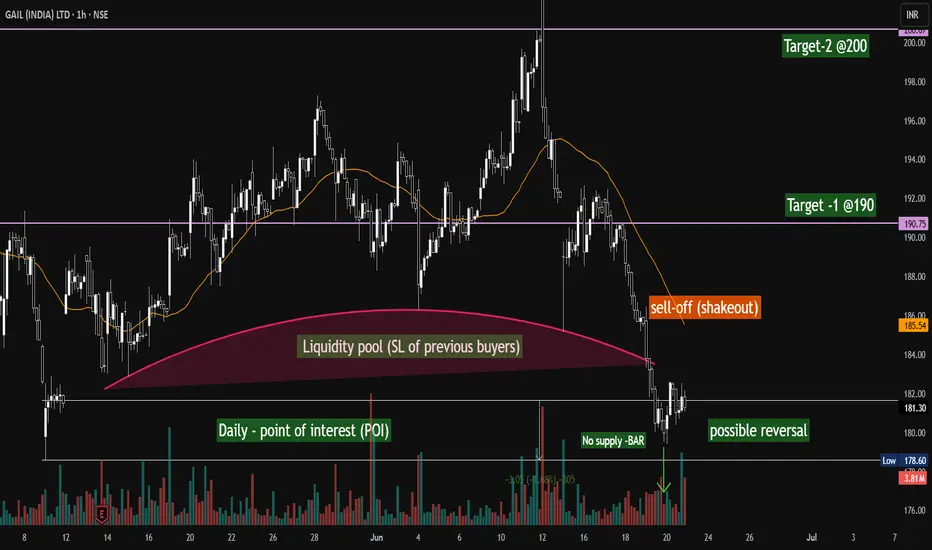
GAIL (INDIA) - Possible Reversal on the corner...GAIL (India) Ltd – 1H Chart Analysis (NSE) | June 21, 2025
Spotted a potential setup with key institutional footprints on the 1H chart:
🟥 Liquidity Pool Grab: Price dipped into the liquidity zone (SL sweep of previous buyers), potentially clearing weak hands.
📉 Shakeout Sell-Off: A sharp decline
Short GAIL till 175 SL 192 Buy at 175 again and hold for upside🔍 Technical Breakdown (as per chart)
1. Rising Support Trendline
The white upward sloping trendline is currently acting as a long-term support.
Price is now approaching this trendline, which sits near ₹180–182 zone — a strong demand area.
2. Gann Time Cycle / Vertical Lines
Blue and yellow vertica

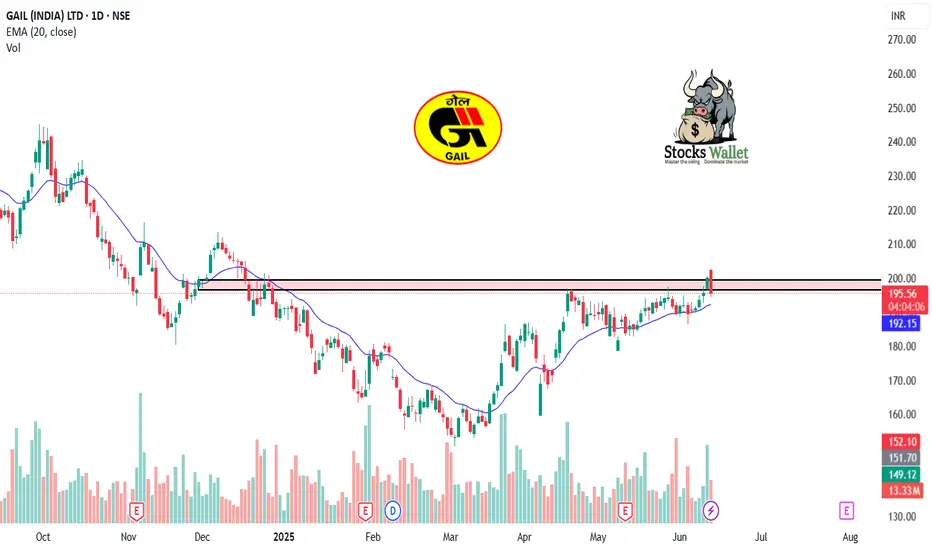
GAIL – Daily Timeframe , about to boomFollow us for more such content.
GAIL is showing strong signs of a bullish breakout, with price holding steadily above key moving averages and positive trend indicators. Institutional accumulation appears to be behind this move, and a close above resistance could see significant upside.
There is a h
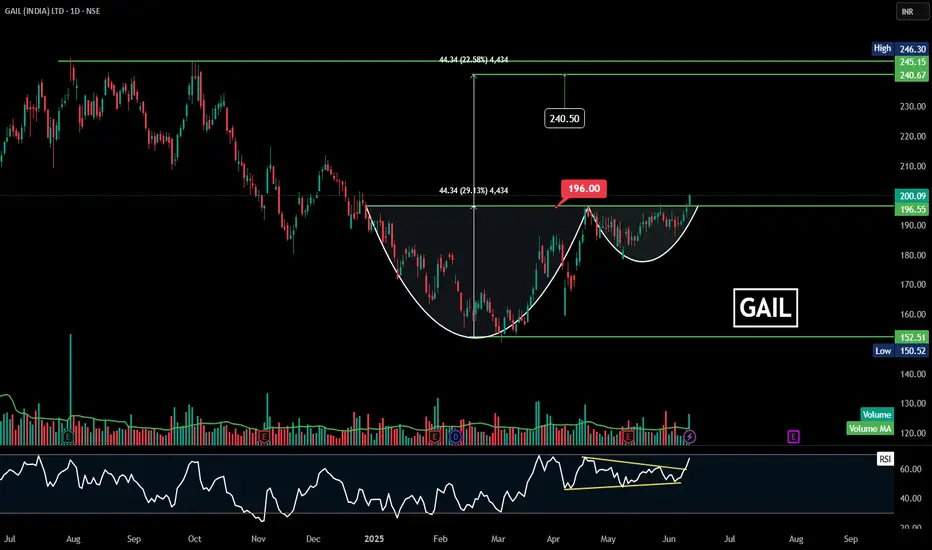
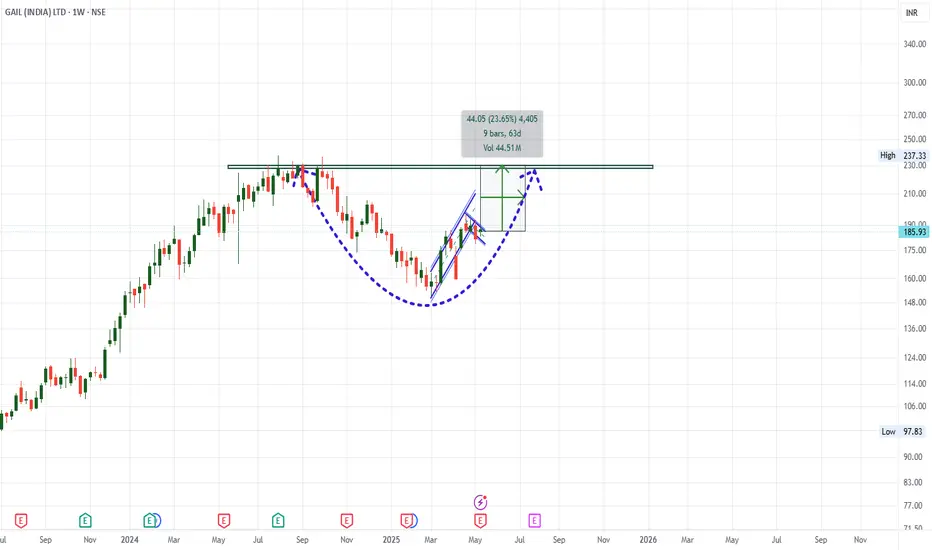
GAIL | Cup and Handle | Breakout | Daily
### 🏺 **Pattern Overview:**
✅ **Cup and Handle Breakout:**
* **Cup bottom:** \~₹152.51
* **Handle breakout level:** ₹196.00 (recently crossed)
* **Current price:** ₹200.09
The **measured move** (height of the cup) suggests a **target price of ₹240.50**.
---
### 📊 **Key Chart Levels:**
* **Res
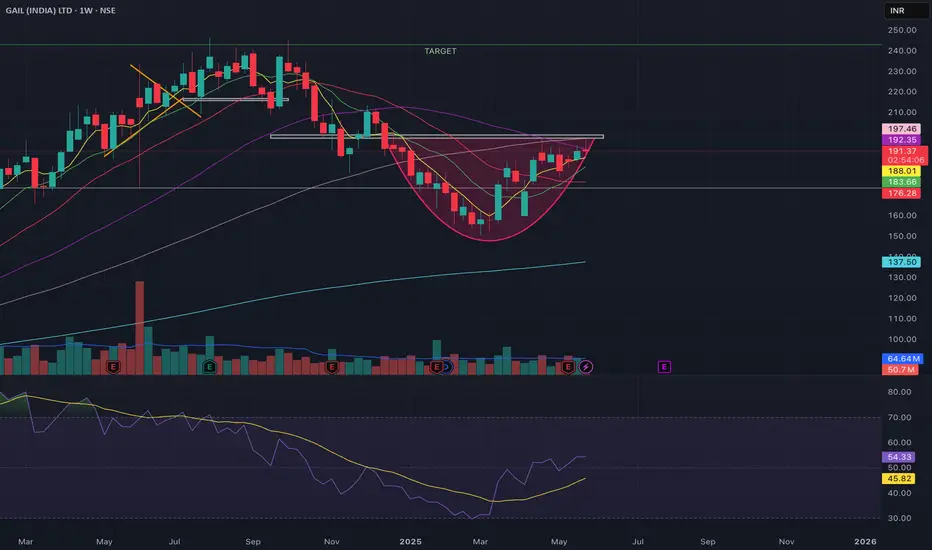
GAIL is all set to touch 240ROUNDING pattern in W.
Presently at resistance of 200.
Strong build ups are happening Week on Week.
RSI divergence with strength.
MA supports are taken.
Target of 240+ , SL 180, CMP: 192
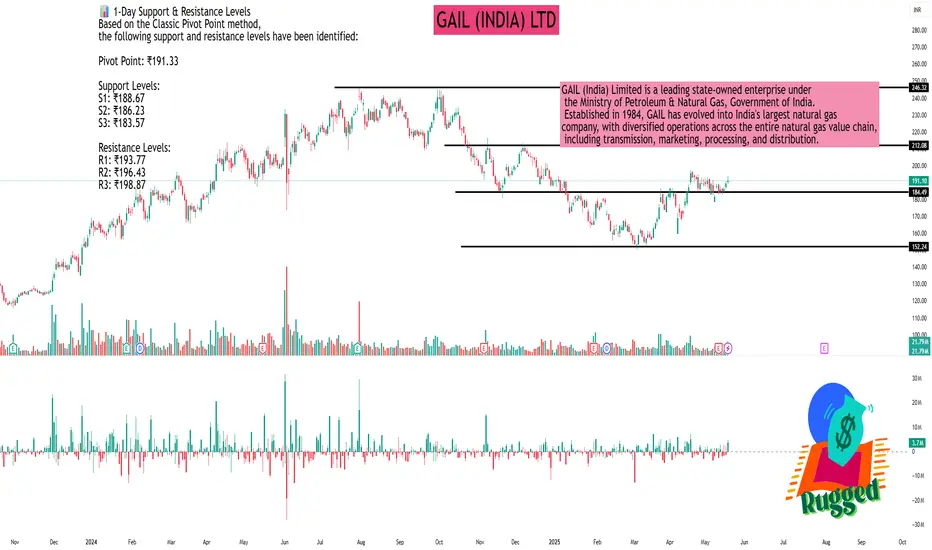
GAIL (INDIA) LTDAs of May 21, 2025, GAIL (India) Ltd. (NSE: GAIL) is trading at ₹191.10, reflecting a 0.86% increase from the previous close.
📊 1-Day Support & Resistance Levels
Based on the Classic Pivot Point method, the following support and resistance levels have been identified:
Pivot Point: ₹191.33
Suppor
Trendline BreakoutA trendline breakout occurs when the price of an asset moves decisievly above a downward- sloping trendline, potentially signalling a change in the prevaling trend.
Entry at around 190
with stop loss of 180 we can target 207 one it closes above 196.

Gail 28% Upside possibility in next 3-4 MonthsGail 28% Upside possibility in next 3-4 Months
Now that the Gail Results are already declared & no much surprise notices ... Stock may be ready to breakout from current flag Pattern to reach its ATH 230-240 Band.
Also Weekly chart suggest CUP formation in progress post Bottom formation near 152.
See all ideas
Summarizing what the indicators are suggesting.
Neutral
SellBuy
Strong sellStrong buy
Strong sellSellNeutralBuyStrong buy
Neutral
SellBuy
Strong sellStrong buy
Strong sellSellNeutralBuyStrong buy
Neutral
SellBuy
Strong sellStrong buy
Strong sellSellNeutralBuyStrong buy
An aggregate view of professional's ratings.
Neutral
SellBuy
Strong sellStrong buy
Strong sellSellNeutralBuyStrong buy
Neutral
SellBuy
Strong sellStrong buy
Strong sellSellNeutralBuyStrong buy
Neutral
SellBuy
Strong sellStrong buy
Strong sellSellNeutralBuyStrong buy
Displays a symbol's price movements over previous years to identify recurring trends.
Frequently Asked Questions
The current price of GAIL is 175.12 INR — it has decreased by −1.38% in the past 24 hours. Watch GAIL (India) Limited stock price performance more closely on the chart.
Depending on the exchange, the stock ticker may vary. For instance, on NSE exchange GAIL (India) Limited stocks are traded under the ticker GAIL.
GAIL stock has fallen by −5.01% compared to the previous week, the month change is a −1.33% fall, over the last year GAIL (India) Limited has showed a −25.16% decrease.
We've gathered analysts' opinions on GAIL (India) Limited future price: according to them, GAIL price has a max estimate of 270.00 INR and a min estimate of 150.00 INR. Watch GAIL chart and read a more detailed GAIL (India) Limited stock forecast: see what analysts think of GAIL (India) Limited and suggest that you do with its stocks.
GAIL reached its all-time high on Jul 31, 2024 with the price of 246.30 INR, and its all-time low was 5.38 INR and was reached on Sep 17, 2001. View more price dynamics on GAIL chart.
See other stocks reaching their highest and lowest prices.
See other stocks reaching their highest and lowest prices.
GAIL stock is 1.98% volatile and has beta coefficient of 1.58. Track GAIL (India) Limited stock price on the chart and check out the list of the most volatile stocks — is GAIL (India) Limited there?
Today GAIL (India) Limited has the market capitalization of 1.13 T, it has increased by 1.48% over the last week.
Yes, you can track GAIL (India) Limited financials in yearly and quarterly reports right on TradingView.
GAIL (India) Limited is going to release the next earnings report on Nov 6, 2025. Keep track of upcoming events with our Earnings Calendar.
GAIL earnings for the last quarter are 2.90 INR per share, whereas the estimation was 3.20 INR resulting in a −9.39% surprise. The estimated earnings for the next quarter are 3.73 INR per share. See more details about GAIL (India) Limited earnings.
GAIL (India) Limited revenue for the last quarter amounts to 347.69 B INR, despite the estimated figure of 351.29 B INR. In the next quarter, revenue is expected to reach 345.70 B INR.
GAIL net income for the last quarter is 23.69 B INR, while the quarter before that showed 24.92 B INR of net income which accounts for −4.92% change. Track more GAIL (India) Limited financial stats to get the full picture.
GAIL (India) Limited dividend yield was 4.10% in 2024, and payout ratio reached 39.61%. The year before the numbers were 3.04% and 36.53% correspondingly. See high-dividend stocks and find more opportunities for your portfolio.
As of Sep 29, 2025, the company has 27.09 K employees. See our rating of the largest employees — is GAIL (India) Limited on this list?
EBITDA measures a company's operating performance, its growth signifies an improvement in the efficiency of a company. GAIL (India) Limited EBITDA is 143.11 B INR, and current EBITDA margin is 11.17%. See more stats in GAIL (India) Limited financial statements.
Like other stocks, GAIL shares are traded on stock exchanges, e.g. Nasdaq, Nyse, Euronext, and the easiest way to buy them is through an online stock broker. To do this, you need to open an account and follow a broker's procedures, then start trading. You can trade GAIL (India) Limited stock right from TradingView charts — choose your broker and connect to your account.
Investing in stocks requires a comprehensive research: you should carefully study all the available data, e.g. company's financials, related news, and its technical analysis. So GAIL (India) Limited technincal analysis shows the sell today, and its 1 week rating is sell. Since market conditions are prone to changes, it's worth looking a bit further into the future — according to the 1 month rating GAIL (India) Limited stock shows the buy signal. See more of GAIL (India) Limited technicals for a more comprehensive analysis.
If you're still not sure, try looking for inspiration in our curated watchlists.
If you're still not sure, try looking for inspiration in our curated watchlists.