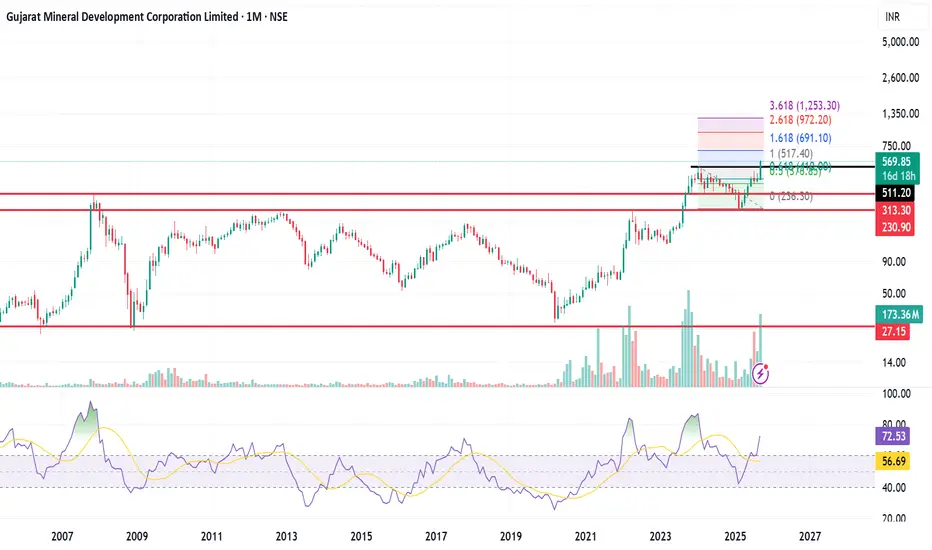
MOMENTUM STOCK- HIGH VOLUME ACTION AT TOP OF CONSOLIDATIONPrice above 20, 50 & 200 SMA.
RSI > 60 in Weekly and daily.
MACD - positive crossover
ADX (5) > 20
Gujarat Mineral Development Corporation Limited
No trades
Next report date
—
Report period
—
EPS estimate
—
Revenue estimate
—
31.55 INR
6.86 B INR
28.51 B INR
82.68 M
About Gujarat Mineral Development Corporation Limited
Sector
Industry
CEO
Roopwant Singh
Website
Headquarters
Ahmedabad
Founded
1963
IPO date
Jan 8, 1998
Identifiers
2
ISIN INE131A01031
Gujarat Mineral Development Corp. Ltd. engages in the development of mineral resources. The firm operates through Mining and Power segments. Its products include lignite, bauxite, fluorspar, manganese, silica sand, limestone, bentonite, and ball clay. The company was founded on May 15, 1963 and is headquartered in Ahmedabad, India.
Related stocks

GMDC - Ascending Triangle viewGMDC ::
Ascending Triangle breakout possibility
Approaching strong resistance zone (multiple rejections earlier)
Need to sustain 635 levels

GMDCLTD – Technical Update | Price Approaching Key ResistanceGMDCLTD has respected the previously identified support zone and is now trading near an important resistance area. The chart structure remains constructive, with price action showing controlled higher-high and higher-low formation.
🔍 Technical Overview:
• Major Support Zone: ₹480
Price formed a st

GMDC 1 Day Time Frame from NSE data:
📊 Daily Pivot & Key Levels (1D Timeframe)
📌 Daily Pivot Point (PP): ₹606.73 – This is the central bias level. Above this suggests short-term bullish control; below may signal weakness.
💥 Resistance Levels (Upside)
R1: ₹627.46 – first major resistance above the pivot
R2: ₹640.38 –

GMDCLTD 1 Day View 📌 Live / Latest Price (approx)
Current NSE Price: ~₹568–₹572 range at latest update.
📊 Daily Pivot, Support & Resistance Levels
(Based on recent pivot calculations for the daily timeframe)
🔵 Pivot (central reference)
Daily Pivot: ~₹566.1–₹572.3 – key mid-point for bias.
🟥 Resistance Levels (Upsid

BUY THE STRONGEST ONE_GMDCLTD_LONGTERM TRADEHi traders,
Posting the interesting Topic on GMDCLTD with Technical Analysis long-term view.
Currently GMDCLTD is trading at INR 595.70 with longer term bullish Veiw.
Entry at current level with stoploss of 12 Months low. Ride the trend until it closes previous yearly low price or Market Structur

Keep Eye reaching trendline support1. 200 EMA + trendline support 💪
2. Good fundamental stock
3. FII increased share in sept quater 2025
Wait for bullish pattern like morning star
Or bullish candle with strong body (not wick)
Not a recommendation.
Not sebi registered.
Do your own analysis.

BUY TODAY SELL TOMORROW for 5%DON’T HAVE TIME TO MANAGE YOUR TRADES?
- Take BTST trades at 3:25 pm every day
- Try to exit by taking 4-7% profit of each trade
- SL can also be maintained as closing below the low of the breakout candle
Now, why do I prefer BTST over swing trades? The primary reason is that I have observed that

GMDC ltd Strong Buy - Short term#GMDCLTD - Clean Technical #Breakout Stock.
#18 years Breakout done earlier and retest also done.
#Strong #Buyondips stock.
Targets in Charts

Buy idea in GMDCLTDThe stock is trading above 60 RSI on D+W+M which shows movement in the stock. The stock has given breakout of 2007, after almost 18 years and consolidated for one and half year. The stock has given breakout with a bullish candle i.e marubozu candle or king candle.
See all ideas
Summarizing what the indicators are suggesting.
Neutral
SellBuy
Strong sellStrong buy
Strong sellSellNeutralBuyStrong buy
Neutral
SellBuy
Strong sellStrong buy
Strong sellSellNeutralBuyStrong buy
Neutral
SellBuy
Strong sellStrong buy
Strong sellSellNeutralBuyStrong buy
An aggregate view of professional's ratings.
Neutral
SellBuy
Strong sellStrong buy
Strong sellSellNeutralBuyStrong buy
Neutral
SellBuy
Strong sellStrong buy
Strong sellSellNeutralBuyStrong buy
Neutral
SellBuy
Strong sellStrong buy
Strong sellSellNeutralBuyStrong buy
Displays a symbol's price movements over previous years to identify recurring trends.
SMALLCAP
Mirae Asset Nifty Smallcap 250 Momentum Quality 100 ETF Units Exchange Traded FundWeight
0.77%
Market value
642.59 K
USD
MIDSMALL
Mirae Asset Nifty MidSmallcap400 Momentum Quality 100 ETFWeight
0.29%
Market value
122.82 K
USD
MOMENTUM50
Motilal Oswal Nifty 500 Momentum 50 ETF Units Exchange Traded FundWeight
0.17%
Market value
52.20 K
USD
Explore more ETFs
Frequently Asked Questions
The current price of GMDCLTD is 600.10 INR — it has decreased by −2.06% in the past 24 hours. Watch Gujarat Mineral Development Corporation Limited stock price performance more closely on the chart.
Depending on the exchange, the stock ticker may vary. For instance, on NSE exchange Gujarat Mineral Development Corporation Limited stocks are traded under the ticker GMDCLTD.
GMDCLTD stock has fallen by −0.28% compared to the previous week, the month change is a −2.08% fall, over the last year Gujarat Mineral Development Corporation Limited has showed a 90.48% increase.
We've gathered analysts' opinions on Gujarat Mineral Development Corporation Limited future price: according to them, GMDCLTD price has a max estimate of 231.00 INR and a min estimate of 231.00 INR. Watch GMDCLTD chart and read a more detailed Gujarat Mineral Development Corporation Limited stock forecast: see what analysts think of Gujarat Mineral Development Corporation Limited and suggest that you do with its stocks.
GMDCLTD reached its all-time high on Oct 10, 2025 with the price of 651.00 INR, and its all-time low was 2.40 INR and was reached on Oct 31, 2000. View more price dynamics on GMDCLTD chart.
See other stocks reaching their highest and lowest prices.
See other stocks reaching their highest and lowest prices.
GMDCLTD stock is 3.67% volatile and has beta coefficient of 2.51. Track Gujarat Mineral Development Corporation Limited stock price on the chart and check out the list of the most volatile stocks — is Gujarat Mineral Development Corporation Limited there?
Today Gujarat Mineral Development Corporation Limited has the market capitalization of 195.30 B, it has increased by 3.63% over the last week.
Yes, you can track Gujarat Mineral Development Corporation Limited financials in yearly and quarterly reports right on TradingView.
Gujarat Mineral Development Corporation Limited is going to release the next earnings report on Feb 13, 2026. Keep track of upcoming events with our Earnings Calendar.
Gujarat Mineral Development Corporation Limited revenue for the last quarter amounts to 5.28 B INR, despite the estimated figure of 5.84 B INR. In the next quarter, revenue is expected to reach 6.22 B INR.
GMDCLTD net income for the last quarter is 4.66 B INR, while the quarter before that showed 1.64 B INR of net income which accounts for 184.39% change. Track more Gujarat Mineral Development Corporation Limited financial stats to get the full picture.
Yes, GMDCLTD dividends are paid annually. The last dividend per share was 10.10 INR. As of today, Dividend Yield (TTM)% is 1.64%. Tracking Gujarat Mineral Development Corporation Limited dividends might help you take more informed decisions.
Gujarat Mineral Development Corporation Limited dividend yield was 3.81% in 2024, and payout ratio reached 46.83%. The year before the numbers were 2.78% and 50.84% correspondingly. See high-dividend stocks and find more opportunities for your portfolio.
As of Feb 7, 2026, the company has 1.78 K employees. See our rating of the largest employees — is Gujarat Mineral Development Corporation Limited on this list?
EBITDA measures a company's operating performance, its growth signifies an improvement in the efficiency of a company. Gujarat Mineral Development Corporation Limited EBITDA is 5.25 B INR, and current EBITDA margin is 23.82%. See more stats in Gujarat Mineral Development Corporation Limited financial statements.
Like other stocks, GMDCLTD shares are traded on stock exchanges, e.g. Nasdaq, Nyse, Euronext, and the easiest way to buy them is through an online stock broker. To do this, you need to open an account and follow a broker's procedures, then start trading. You can trade Gujarat Mineral Development Corporation Limited stock right from TradingView charts — choose your broker and connect to your account.
Investing in stocks requires a comprehensive research: you should carefully study all the available data, e.g. company's financials, related news, and its technical analysis. So Gujarat Mineral Development Corporation Limited technincal analysis shows the buy rating today, and its 1 week rating is buy. Since market conditions are prone to changes, it's worth looking a bit further into the future — according to the 1 month rating Gujarat Mineral Development Corporation Limited stock shows the buy signal. See more of Gujarat Mineral Development Corporation Limited technicals for a more comprehensive analysis.
If you're still not sure, try looking for inspiration in our curated watchlists.
If you're still not sure, try looking for inspiration in our curated watchlists.