BUY THE STRONGEST ONE_GMDCLTD_LONGTERM TRADEHi traders,
Posting the interesting Topic on GMDCLTD with Technical Analysis long-term view.
Currently GMDCLTD is trading at INR 595.70 with longer term bullish Veiw.
Entry at current level with stoploss of 12 Months low. Ride the trend until it closes previous yearly low price or Market Structure.
Note:_ Only for Educational purpose Since investments in Securities and market are subjected to market risk
Gujarat Mineral Development Corporation Limited
No trades
Market insights

Keep Eye reaching trendline support1. 200 EMA + trendline support 💪
2. Good fundamental stock
3. FII increased share in sept quater 2025
Wait for bullish pattern like morning star
Or bullish candle with strong body (not wick)
Not a recommendation.
Not sebi registered.
Do your own analysis.

BUY TODAY SELL TOMORROW for 5%DON’T HAVE TIME TO MANAGE YOUR TRADES?
- Take BTST trades at 3:25 pm every day
- Try to exit by taking 4-7% profit of each trade
- SL can also be maintained as closing below the low of the breakout candle
Now, why do I prefer BTST over swing trades? The primary reason is that I have observed that 90% of the stocks give most of the movement in just 1-2 days and the rest of the time they either consolidate or fall
Trendline Breakout in GMDCLTD
BUY TODAY SELL TOMORROW for 5%

GMDC ltd Strong Buy - Short term#GMDCLTD - Clean Technical #Breakout Stock.
#18 years Breakout done earlier and retest also done.
#Strong #Buyondips stock.
Targets in Charts

Buy idea in GMDCLTDThe stock is trading above 60 RSI on D+W+M which shows movement in the stock. The stock has given breakout of 2007, after almost 18 years and consolidated for one and half year. The stock has given breakout with a bullish candle i.e marubozu candle or king candle.
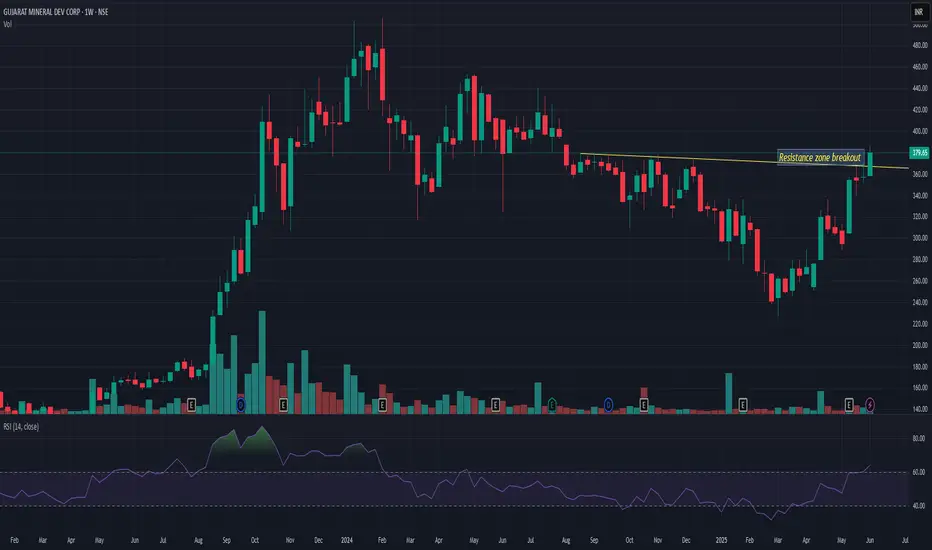
GMDC LTD : Breaking out 18 month resistance. The weekly chart of the GMDC broke out 18 month resistance with good volume of daily and weekly chart.
The RSI is also above 70 indicating the momentum is strong in the counter.
In past similar type of breakout took place twice i.e in Jan 22 and Aug 2023 with RSI above 70 resulted in very good movement in the stock price.
IF the stock sustains the gains for this week can result in further movements in coming weeks.

GMDC Breakout GMDC BREAKOUT on 45 min and 1 hrs. Gmdc is in good Momentum. It's can give another 4 -5% movement easily. It can be achieve 580 tgt easily. It's already moved good.
Now keep trial SL and Enjoy Journey.
Buy was given near 426.
Tgt 580 - 600
Consult your financial advisor before making any position in stock market. My all views are for educational purposes only.
Visit my profile for more information

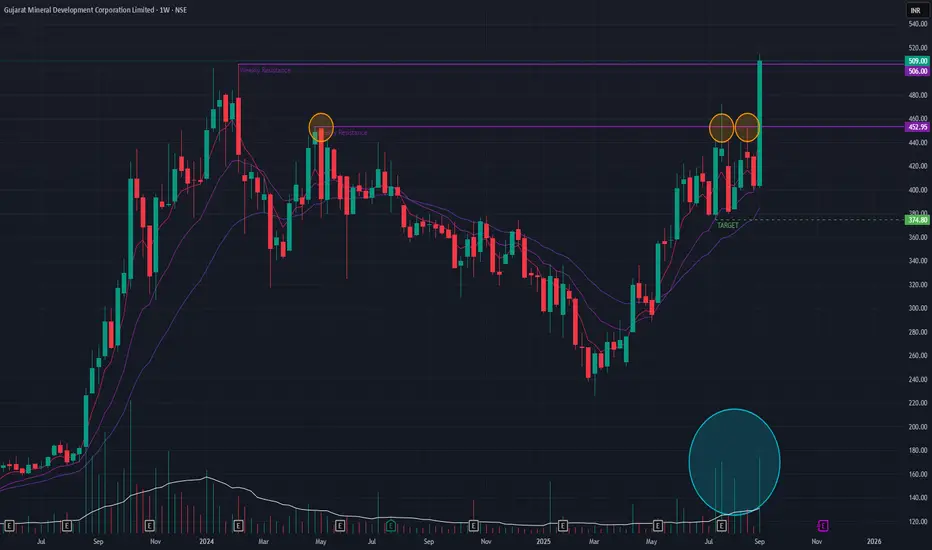
GMDC (Weekly Timeframe) - What next after ATHGMDC was in a short-term downtrend which reversed into an uptrend by Mar 2025. Past few weeks it tried to BreakOut of the horizontal key resistance trendline as indicated. Last week the stock surged by 26.04% with huge volume and made a new ATH. What can we expect after the new ATH, I would expect some profit booking in the coming week.
If the momentum sustains then we may see the stock surge to 640 levels on the upside. On downside, we may see 374 levels. All depending on the coming week's price-action.
To be watched !!
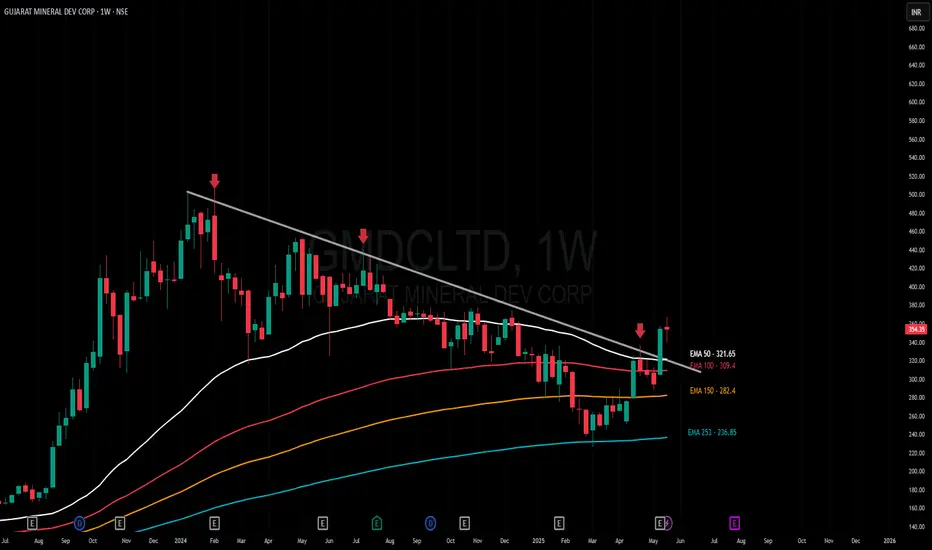
GMDC - Chart of The Week, Testing Trendline, Change of PolarityNSE:GMDCLTD has a beautiful structure on the Weekly Timeframe to qualify for my Chart of the Week idea. It saw Decent Above-Average Volumes and confirmed a Change of Polarity and is Now Testing the Falling Trendline with RSI and MACD trending upwards.
About:
NSE:GMDCLTD is primarily engaged in 2 sectors, i.e. mining and power. Its projects include Lignite, Bauxite, Fluorspar, Multi-Metal, Manganese, Power, Wind and Solar.
Trade Setup:
It could be a good Swing Trade if it breaks the trendline and the Change of Polarity is Still Intact.
If the Trade gets activated after breaking the trendline, then keep this Week's Low as the Stop Loss or Even Take RSI and MACD as a Stop Loss Signal.
📌Thank you for exploring my idea! I hope you found it valuable.
🙏FLLOW for more
👍BOOST if useful
✍️COMMENT below with your views.
Meanwhile, check out my other stock ideas on the right side until this trade is activated. I would love your feedback.
Disclaimer: "I am not SEBI REGISTERED RESEARCH ANALYST AND INVESTMENT ADVISER."
This analysis is intended solely for informational and educational purposes and should not be interpreted as financial advice. It is advisable to consult a qualified financial advisor or conduct thorough research before making investment decisions.

#GMDCLTD - Inverse H&S Breakout in Weekly Time Frame Script: GMDCLTD
Key highlights: 💡⚡
📈 Inverse Head & Shoulders Breakout in Weekly Time Frame
📈 Volume spike during Breakout
📈 MACD Bounce
📈 Can go for a swing trade
BUY ONLY ABOVE 507 DCB
⏱️ C.M.P 📑💰- 509
🟢 Target 🎯🏆 – 50%
⚠️ Stoploss ☠️🚫 – 25%
⚠️ Important: Market conditions are Okish, Position size 50% per Trade. Protect Capital Always
⚠️ Important: Always Exit the trade before any Event.
⚠️ Important: Always maintain your Risk:Reward Ratio as 1:2, with this RR, you only need a 33% win rate to Breakeven.
✅Like and follow to never miss a new idea!✅
Disclaimer: I am not SEBI Registered Advisor. My posts are purely for training and educational purposes.
Eat🍜 Sleep😴 TradingView📈 Repeat 🔁
Happy learning with MMT. Cheers!🥂
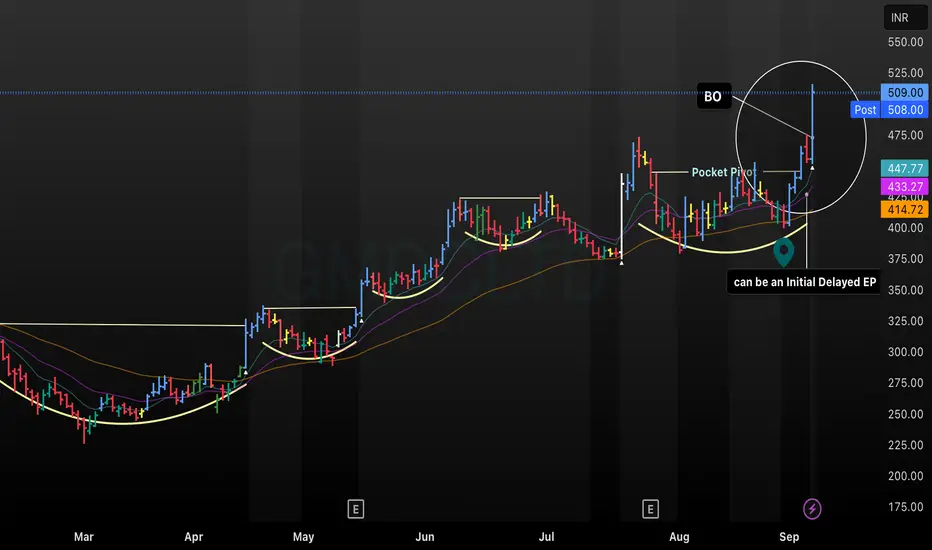
GMDC Delayed Entry Opportunity After Bullish Breakout• Breakout (BO) above resistance with price surging 11.82% to ₹509, confirming bullish momentum.
• Pocket pivot and moving averages align, supporting continued uptrend strength post-consolidation.
• The chart identifies an initial delayed entry point, useful for swing and positional traders capitalizing on fresh momentum.
• Suitable for traders looking for technical clarity on entry triggers, resistance flips, and trend confirmation.
Buy, Sell, Retest or Sit Out? | Ep. 1 – Trade Decision SeriesCharts in this video are over 3 months old. This is for educational purposes only, using TradingView’s replay feature to demonstrate strategy thinking and decision-making. Not financial advice.

GMDC- HEADING FOR Rs.525?Government-Backed & Debt-Free
It’s a state-owned PSU with a debt-free balance sheet, offering financial stability and lower risk.
Consistent Profit Growth
Total Income: ₹904.5 Cr (↑ ~10% YoY)
Net Profit: ₹226.2 Cr (↑ ~20.8% YoY; ↑ ~53% QoQ from ₹147.7 Cr in Q3)
EBITDA: ₹311.8 Cr (↑ ~51% QoQ)

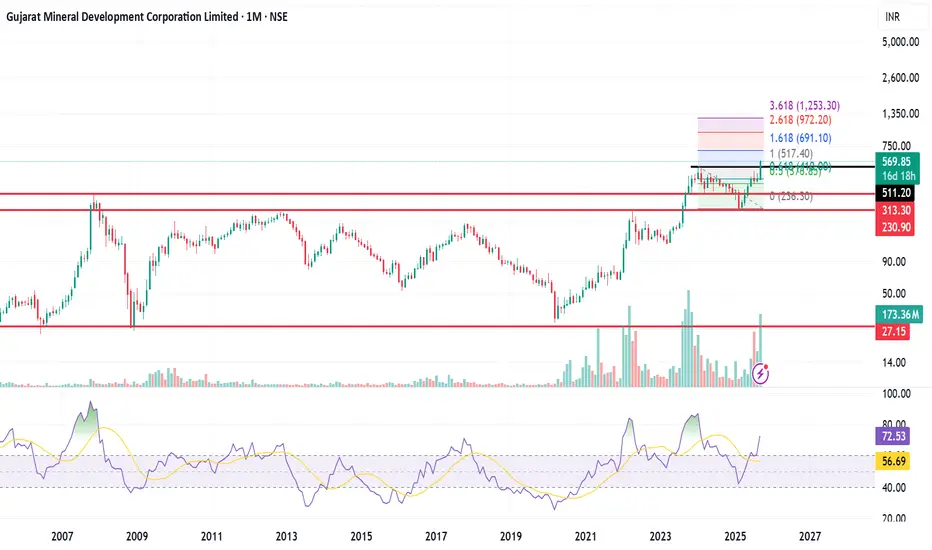
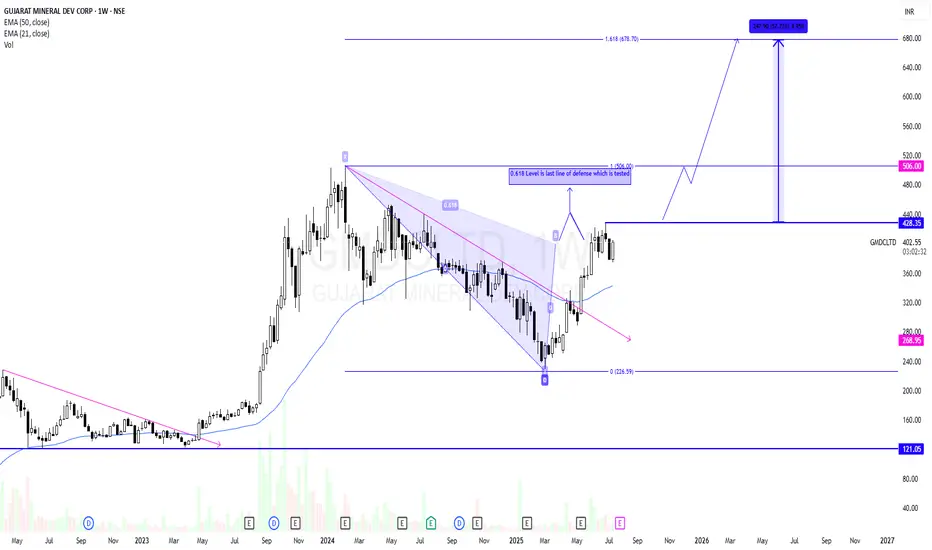
GMDCLTD - Potential Swing CandidateGMDCLTD has recently ended its correction phase and reversed. It has retraced till 0.618 level and has got a small rejection. 0.618 is last line of defence for sellers in many cases. Above 0.618 level a strong momentum likely to come.
Risk will be previous swing low after breakout.
As per price structure 430 is the last swing high. Breakout will start a strong momentum towards ATH and above that it is likely to test 678 as per Fib extension.
So put an alert to track this for your learning.
Learning Part :-
A rise in price then a correction in a channel formation is good to buy on breakout.
I am Not SEBI Registered
This is my personal analysis for my personal trading. Kindly consult your financial advisor before taking any actions based on this.
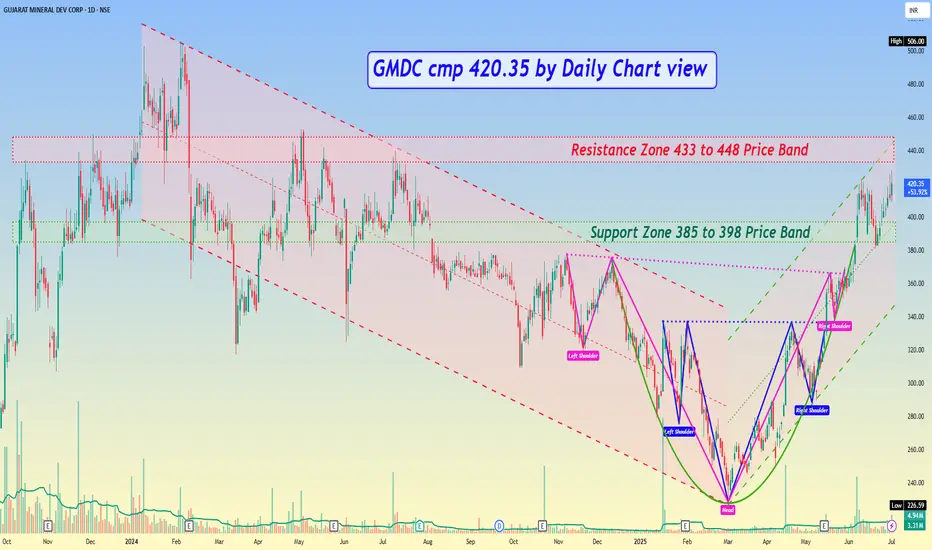
GMDC cmp 420.35 by Daily Chart viewGMDC cmp 420.35 by Daily Chart view
- Support Zone 385 to 398 Price Band
- Resistance Zone 433 to 448 Price Band
- Falling Price Channel to Rising Price Channel transition
- Volumes are in good sync with average traded quantity
- Double Head and Shoulders inclusive of Bullish Rounding Bottom
- Support Zone was tested retested and now attempts to crossover Resistance Zone
GMDCLTD GMDCLTD seems very strong on weekly charts. Shown strong momentum in recent trading days. And closing above 200 MA since last 5-7 sessions. Now if it closes above 385 then again it may resume its uptrend and may go up to 460 levels from here. 350 is very strong support. So closing below this may change my view
Amazing breakout on WEEKLY Timeframe - GMDCLTDCheckout an amazing breakout happened in the stock in Weekly timeframe, macroscopically seen in Daily timeframe. Having a great favor that the stock might be bullish expecting a staggering returns of minimum 25% TGT. IMPORTANT BREAKOUT LEVELS ARE ALWAYS RESPECTED!
NOTE for learners: Place the breakout levels as per the chart shared and track it yourself to get amazed!!
#No complicated chart patterns
#No big big indicators
#No Excel sheet or number magics
TRADE IDEA: WAIT FOR THE STOCK TO BREAKOUT IN WEEKLY TIMEFRAME ABOVE THIS LEVEL.
Checkout an amazing breakout happened in the stock in Weekly timeframe.
Breakouts happening in longer timeframe is way more powerful than the breakouts seen in Daily timeframe. You can blindly invest once the weekly candle closes above the breakout line and stay invested forever. Also these stocks breakouts are lifelong predictions, it means technically these breakouts happen giving more returns in the longer runs. Hence, even when the scrip makes a loss of 10% / 20% / 30% / 50%, the stock will regain and turn around. Once they again enter the same breakout level, they will flyyyyyyyyyyyy like a ROCKET if held in the portfolio in the longer run.
Time makes money, GREEDY & EGO will not make money.
Also, magically these breakouts tend to prove that the companies turn around and fundamentally becoming strong. Also the magic happens when more diversification is done in various sectors under various scripts with equal money invested in each N500 scripts.
The real deal is when to purchase and where to purchase the stock. That is where Breakout study comes into play.
Check this stock which has made an all time low and high chances that it makes a "V" shaped recovery.
> Taking support at last years support or breakout level
> High chances that it reverses from this point.
> Volume dried up badly in last few months / days.
> Very high suspicion based analysis and not based on chart patterns / candle patterns deeply.
> VALUABLE STOCK AVAILABLE AT A DISCOUNTED PRICE
> OPPURTUNITY TO ACCUMULATE ADEQUATE QUANTITY
> MARKET AFTER A CORRECTION / PANIC FALL TO MAKE GOOD INVESTMENT
DISCLAIMER : This is just for educational purpose. This type of analysis is equivalent to catching a falling knife. If you are a warrior, you throw all the knives back else you will be sorrow if it hits SL. Make sure to do your analysis well. This type of analysis only suits high risks investor and whose is willing to throw all the knives above irrespective of any sectoral rotation. BE VERY CAUTIOUS AS IT IS EXTREME BOTTOM FISHING.
HOWEVER, THIS IS HOW MULTIBAGGERS ARE CAUGHT !
STOCK IS AT RIGHT PE / RIGHT EVALUATION / MORE ROAD TO GROW / CORRECTED IV / EXCELLENT BOOKS / USING MARKET CRASH AS AN OPPURTUNITY / EPS AT SKY.
LET'S PUMP IN SOME MONEY AND REVOLUTIONIZE THE NATION'S ECONOMY!
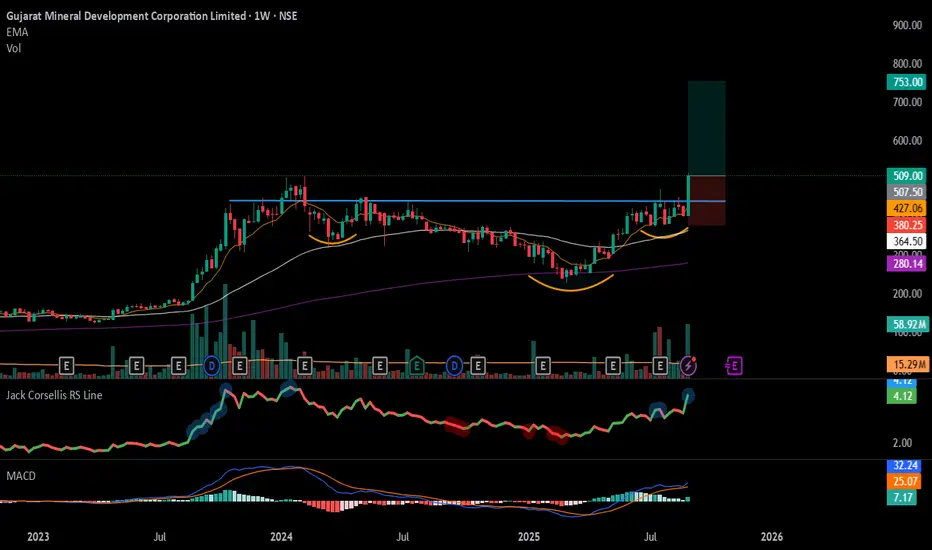
GMDC📈 GMDC – Multi-Year Breakout Retest Complete, Ready for Next Leg Up 🚀
🧱 Multi-Year Breakout Confirmed
GMDC broke out of a massive multi-year supply zone (₹175–₹240) in September 2023, which had previously acted as a strong resistance since 2013. This is a structural breakout on the weekly chart, indicating a powerful shift in long-term trend.
✅ Breakout level retested in March 2025 with a clean bounce — confirming the zone has flipped from supply to demand.
✅ The breakout was high-volume supported, strengthening the bullish conviction.
💹 Price Structure & Trend
Price is trading well above all key moving averages on daily timeframe(20 EMA, 50 EMA, 200 EMA).
The recent series of higher lows signals a re-accumulation phase post-retest.
A falling trendline from the top is now broken, showing trend reversal confirmation.
🔥 Relative Strength & Demand
Relative Strength vs Nifty is trending upward, indicating sector and stock-level outperformance.
The stock has shown decent price strength in a weak broader market, highlighting institutional interest.
Volume clusters around the breakout and retest zones point to strong buyer absorption.
📊 Conclusion
GMDC is presenting a high conviction long setup with:
A successful multi-year breakout and retest,
Strong relative strength and price action,
Bullish demand dynamics backed by moving average confluence and volume,
And a favorable risk-reward ratio.
🔔 Keep this on your watchlist — the next impulsive move may just be getting started.

Daily Timeframe Breakout there is a good breakout on daily timeframe
good volumes spike after a long days
multiple time counter trend line rejections makes best time to entry in the stock

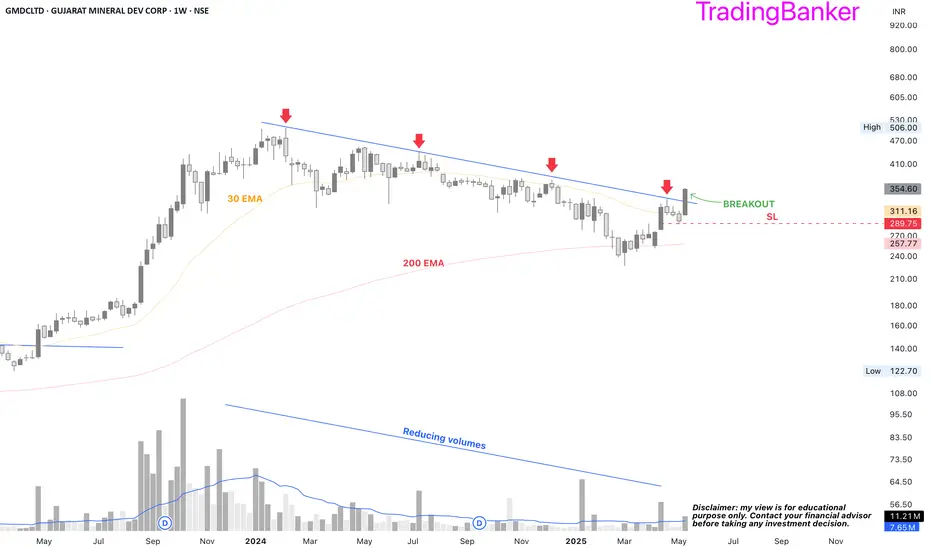
GMDC: a probable long🔸Trendline breakout
🔸30 EMA breakout
🔸Decent financials with 2nd highest ever sales and 3rd highest PAT
🔸Substantial promoter holding
🔸Increase in FII folding although marginal
🔸Capacity expansion underway would pave the way for the highest ever sales and PAT
🔸PE below the industry PE and PEG below 0.50
Gujarat Mineral Development Corp LtdDate : 05.02.2025
GMDC
Timeframe : Day Chart
Remarks :
1 Reversal from positive divergence below neckline of Descending triangle
2 Keep neckline as strict stop loss at 316, cmp 317
3 First target would be recent triple top at 336 around
4 If breaks out out from recent triple top range then 370 is not far
5 If goes below neckline and rsi 50 daily then dont average or bottom fishing
Regards,
Ankur

GMDCLTDSL day candle close only, Target Trigger Price
All detail for chat. good entry at mark price only. and must stoploss minimum risk and good profit. risk ratio 1:1 to manage modified SL. This is not call, Just my idea. Please understand your risk and take full responsibility of your actions

GMDCLTD - Stock to be in RadarPrice consolidate since October 2023 and it forms morning star at support line now. Please enter once the price breakout triangle.
