GPIL 1 Day Time Frame 📊 Current Price Snapshot (India)
• GPIL current live price: ~₹250–₹265 range in latest sessions (previous close ~₹250.97 to ~₹262.6 in intraday updates) — this can vary minute-by-minute during market hours.
• 52-week range: ₹145.75 (low) / ₹290.00 (high).
🔎 Daily Pivot Support & Resistance Levels (
Godawari Power & Ispat Ltd.
No trades
Next report date
—
Report period
—
EPS estimate
—
Revenue estimate
—
11.80 INR
8.12 B INR
53.76 B INR
244.10 M
About Godawari Power & Ispat Ltd.
Sector
Industry
CEO
Bajrang Lal Agrawal
Website
Headquarters
Raipur
Founded
1999
IPO date
Mar 28, 2006
Identifiers
2
ISIN INE177H01039
Godawari Power & Ispat Ltd. engages in the business of manufacturing iron and steel products. It is also involved in mining captive iron ore and production of iron ore pellets, sponge iron, steel billets, wire rods, HB wires, and ferro alloys with generation of electricity. The company was founded on September 21, 1999 and is headquartered in Raipur, India.
Related stocks

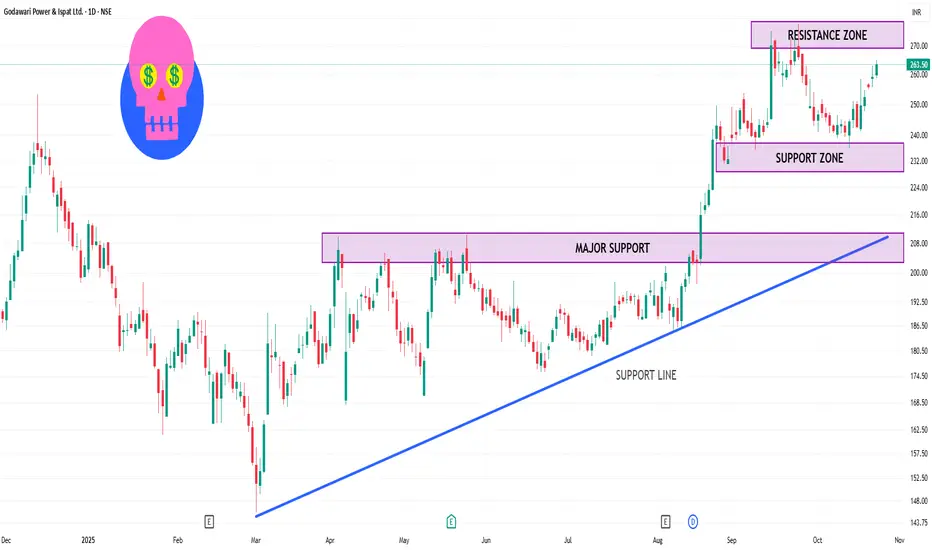
Godawari Power GPIL cmp 250.50 by Daily Chart viewGodawari Power GPIL cmp 250.50 by Daily Chart view
* Support Zone 224 to 236 Price Band
* Resistance Zone 249 to 263 Price Band
* Support Zone tested retested since a month
* Volumes building up for Resistance Zone Breakout

GPIL 1 Day Time Frame 📊 Intraday Levels
Resistance Levels:
R1: ₹263.00
R2: ₹266.69
R3: ₹270.39
R4: ₹274.09
Support Levels:
S1: ₹259.30
S2: ₹255.61
S3: ₹251.91
S4: ₹248.22
These levels are derived from standard pivot point calculations and are commonly used by traders to identify potential entry and exi
Godawari Power And Ispat Limited - Breakout Setup, Move is ON...#GPIL trading above Resistance of 793
Next Resistance is at 1270
Support is at 497
Here is previous chart:
Chart is self explanatory. Levels of breakout, possible up-moves (where stock may find resistances) and support (close below which, setup will be invalidated) are clearly defined.
Discla

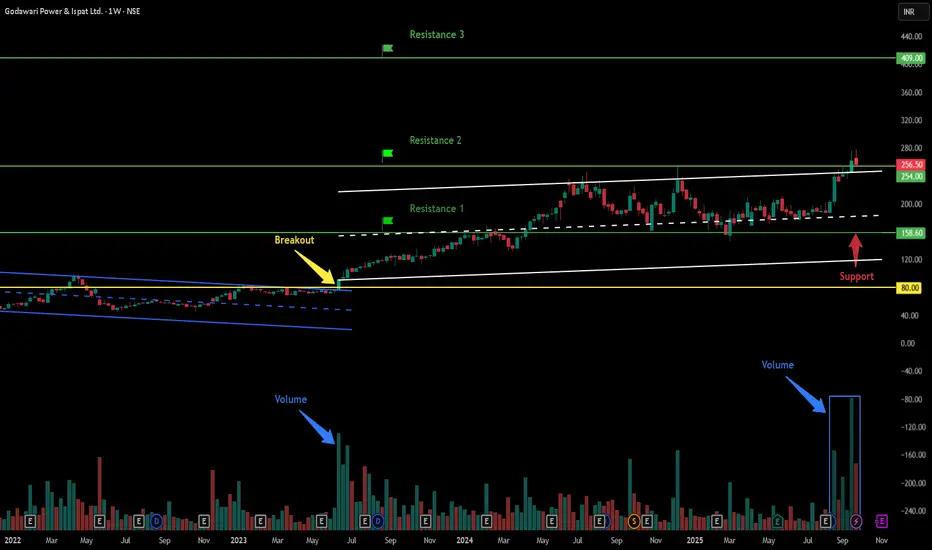
Godawari Power And Ispat Limited - Breakout Setup, Move is ON...#GPIL trading above Resistance of 254
Next Resistance is at 409
Support is at 158.60
Here are previous charts:
Chart is self explanatory. Levels of breakout, possible up-moves (where stock may find resistances) and support (close below which, setup will be invalidated) are clearly defined.
GPIL Breakout After 138-Day Long Base | Price Action AnalysisThis chart highlights a strong breakout in GPIL after consolidating for 138 days in a long-term base. The price surged over 10% to ₹270.15 on significant volume, confirming the breakout. Key moving averages support the uptrend, and fundamental data shows improving quarterly results and robust sector

BUY TODAY SELL TOMORROW for 5%DON’T HAVE TIME TO MANAGE YOUR TRADES?
- Take BTST trades at 3:25 pm every day
- Try to exit by taking 4-7% profit of each trade
- SL can also be maintained as closing below the low of the breakout candle
Now, why do I prefer BTST over swing trades? The primary reason is that I have observed that

GPIL - Cup & Handle Breakout | Daily Chart📊 GPIL – Cup & Handle Breakout with Explosive Volume | RSI > 80
📅 Chart Date: August 24, 2025
📍 CMP: ₹238.61 (+6.91%)
📈 Symbol: NSE:GPIL | 1D Timeframe
🔍 Technical Analysis
☕ Cup & Handle Breakout
A multi-month Cup & Handle pattern has been completed.
Price gave a strong breakout above the neckline
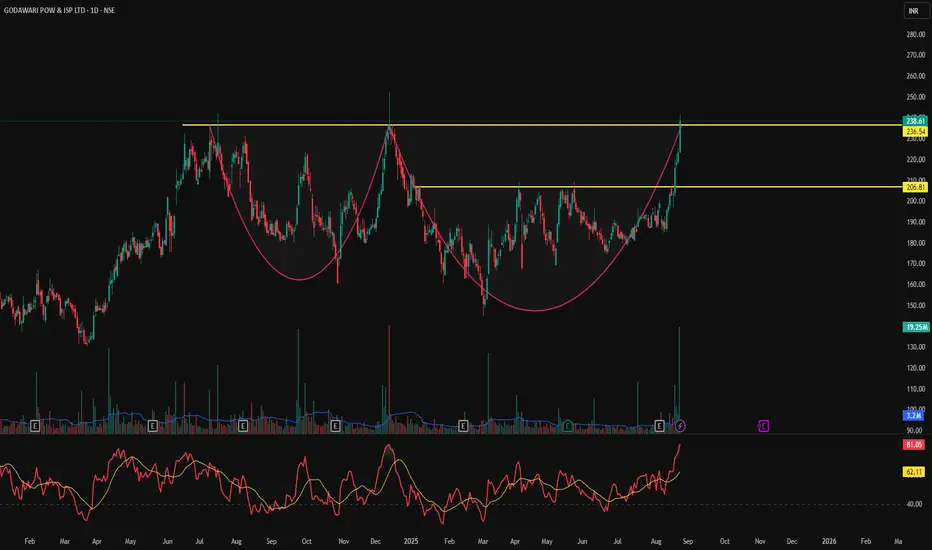
GPIL - GODAWARI POWER & ISPAT LTDThe formation suggests a CUP is being prepared and eventually the CUP would be completed.
Scope for around 19-24% upside.
Godawari Power & Ispat is mainly engaged in the business of Mining of Iron Ore and Manufacturing of Iron Ore Pellets, Sponge Iron, Steel Billets, Wire Rods, H.B. Wire and Ferro

BUY TODAY SELL TOMORROW for 5%DON’T HAVE TIME TO MANAGE YOUR TRADES?
- Take BTST trades at 3:25 pm every day
- Try to exit by taking 4-7% profit of each trade
- SL can also be maintained as closing below the low of the breakout candle
Now, why do I prefer BTST over swing trades? The primary reason is that I have observed that

See all ideas
Summarizing what the indicators are suggesting.
Neutral
SellBuy
Strong sellStrong buy
Strong sellSellNeutralBuyStrong buy
Neutral
SellBuy
Strong sellStrong buy
Strong sellSellNeutralBuyStrong buy
Neutral
SellBuy
Strong sellStrong buy
Strong sellSellNeutralBuyStrong buy
An aggregate view of professional's ratings.
Neutral
SellBuy
Strong sellStrong buy
Strong sellSellNeutralBuyStrong buy
Neutral
SellBuy
Strong sellStrong buy
Strong sellSellNeutralBuyStrong buy
Neutral
SellBuy
Strong sellStrong buy
Strong sellSellNeutralBuyStrong buy
Displays a symbol's price movements over previous years to identify recurring trends.
SMALLCAP
Mirae Asset Nifty Smallcap 250 Momentum Quality 100 ETF Units Exchange Traded FundWeight
0.86%
Market value
718.57 K
USD
Explore more ETFs
Frequently Asked Questions
The current price of GPIL is 267.90 INR — it has decreased by −2.54% in the past 24 hours. Watch Godawari Power & Ispat Ltd. stock price performance more closely on the chart.
Depending on the exchange, the stock ticker may vary. For instance, on NSE exchange Godawari Power & Ispat Ltd. stocks are traded under the ticker GPIL.
GPIL stock has risen by 0.27% compared to the previous week, the month change is a −0.29% fall, over the last year Godawari Power & Ispat Ltd. has showed a 52.87% increase.
We've gathered analysts' opinions on Godawari Power & Ispat Ltd. future price: according to them, GPIL price has a max estimate of 275.00 INR and a min estimate of 273.00 INR. Watch GPIL chart and read a more detailed Godawari Power & Ispat Ltd. stock forecast: see what analysts think of Godawari Power & Ispat Ltd. and suggest that you do with its stocks.
GPIL reached its all-time high on Oct 29, 2025 with the price of 290.00 INR, and its all-time low was 1.95 INR and was reached on Mar 2, 2009. View more price dynamics on GPIL chart.
See other stocks reaching their highest and lowest prices.
See other stocks reaching their highest and lowest prices.
GPIL stock is 4.83% volatile and has beta coefficient of 1.40. Track Godawari Power & Ispat Ltd. stock price on the chart and check out the list of the most volatile stocks — is Godawari Power & Ispat Ltd. there?
Today Godawari Power & Ispat Ltd. has the market capitalization of 172.94 B, it has increased by 2.16% over the last week.
Yes, you can track Godawari Power & Ispat Ltd. financials in yearly and quarterly reports right on TradingView.
Godawari Power & Ispat Ltd. is going to release the next earnings report on May 26, 2026. Keep track of upcoming events with our Earnings Calendar.
GPIL net income for the last quarter is 1.43 B INR, while the quarter before that showed 1.61 B INR of net income which accounts for −11.27% change. Track more Godawari Power & Ispat Ltd. financial stats to get the full picture.
Yes, GPIL dividends are paid annually. The last dividend per share was 1.00 INR. As of today, Dividend Yield (TTM)% is 0.39%. Tracking Godawari Power & Ispat Ltd. dividends might help you take more informed decisions.
Godawari Power & Ispat Ltd. dividend yield was 0.56% in 2024, and payout ratio reached 7.55%. The year before the numbers were 0.66% and 6.67% correspondingly. See high-dividend stocks and find more opportunities for your portfolio.
As of Feb 16, 2026, the company has 5.95 K employees. See our rating of the largest employees — is Godawari Power & Ispat Ltd. on this list?
EBITDA measures a company's operating performance, its growth signifies an improvement in the efficiency of a company. Godawari Power & Ispat Ltd. EBITDA is 11.32 B INR, and current EBITDA margin is 22.72%. See more stats in Godawari Power & Ispat Ltd. financial statements.
Like other stocks, GPIL shares are traded on stock exchanges, e.g. Nasdaq, Nyse, Euronext, and the easiest way to buy them is through an online stock broker. To do this, you need to open an account and follow a broker's procedures, then start trading. You can trade Godawari Power & Ispat Ltd. stock right from TradingView charts — choose your broker and connect to your account.
Investing in stocks requires a comprehensive research: you should carefully study all the available data, e.g. company's financials, related news, and its technical analysis. So Godawari Power & Ispat Ltd. technincal analysis shows the strong buy rating today, and its 1 week rating is buy. Since market conditions are prone to changes, it's worth looking a bit further into the future — according to the 1 month rating Godawari Power & Ispat Ltd. stock shows the strong buy signal. See more of Godawari Power & Ispat Ltd. technicals for a more comprehensive analysis.
If you're still not sure, try looking for inspiration in our curated watchlists.
If you're still not sure, try looking for inspiration in our curated watchlists.