Moving ahead to ATH_Grasim Industries Ltd. 🔎 Technical Chart Analysis (Weekly)
1. Price Structure & Trend
The stock has been in a primary uptrend since mid-2023, making higher highs and higher lows.
After consolidating between ₹2,400 – ₹2,800 for several months in 2025, the stock is now attempting a breakout.
2. Resistance & Support Zone
Next report date
—
Report period
—
EPS estimate
—
Revenue estimate
—
64.60 INR
37.06 B INR
1.48 T INR
356.91 M
About Grasim Industries Ltd.
Sector
Industry
CEO
Himanshu Kapania
Website
Headquarters
Mumbai
Founded
1947
IPO date
Nov 25, 1992
Identifiers
2
ISIN INE047A01021
Grasim Industries Ltd. engages in the production of chemicals and cement. It operates through the following segments: Cellulosic Fibres, Chemicals, Building Materials, Financial Services, and Others. The Cellulosic Fibres segment refers to Cellulosic Staple Fibre (CSF) and Cellulosic Fashion Yarn (CFY). The Chemicals segment includes Chlor Alkali, Specialty Chemicals and Chlorine Derivatives. The Building Materials segment pertains to cement, paints and B2B E-Commerce businesses. The Financial Services segment offers Non-Bank Financial Services, Life Insurance Services, Asset Management (AMC), Housing Finance, and Equity Broking. The Others segment represents the remaining businesses of the Group, mainly represents Textiles, Insulators and Renewable Power business. The company was on August 25, 1947 and is headquartered in Mumbai, India.
Related stocks


Grasim Industries (CMP ₹2,891.7)Pattern: Cup and Handle — retesting neckline post breakout.
Structure: Throwback towards neckline near ₹2,885–₹2,900 zone; strong recovery from base.
Indicators:
RSI above 55, turning upward.
MACD bullish crossover holding.
21 EMA > 50 EMA > 200 EMA — uptrend intact.
Trade Plan:
📈 Buy above:

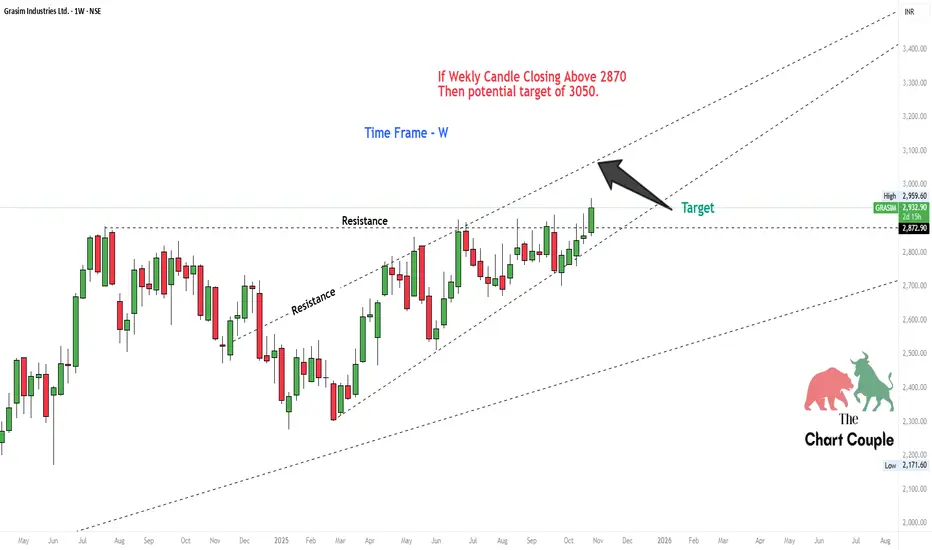
GRASIM Weekly Chart AnalysisThe stock is showing strong momentum within its rising channel!
📈 Key Level to Watch:
If the weekly candle closes above 2870, it could open the gates toward a potential target of 3050.
🧠 Technical View:
Price breaking past resistance zone
Volume confirmation could add strength
Trend remains bul
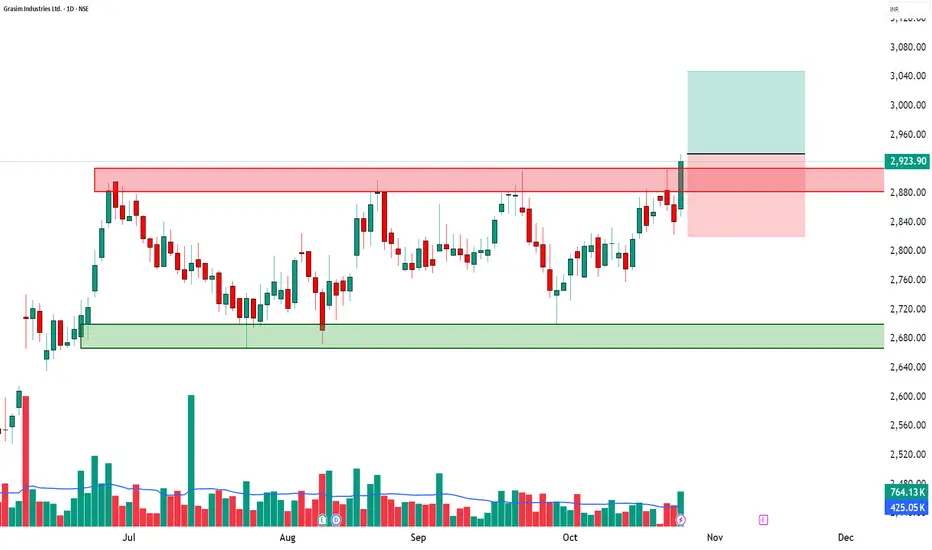
GRASIM | 52-Week Breakout + RSI Surge + High Volume📈 GRASIM | 52-Week Breakout + RSI Surge + High Volume Confirmation 🚀
🔹 Entry Zone: ₹2,923.90 – ₹2,934.00
🔹 Stop Loss: ₹2,820.45 (Risk ~113 pts)
🔹 Supports: 2,869.67 / 2,815.43 / 2,783.27
🔹 Resistances: 2,956.07 / 2,988.23 / 3,042.47
🔹 Swing Demand Zone: ₹2,787 – ₹2,764.50
🔑 Key Highlights
✅ 52-Week
GRASIM : "BHAIYA , YE DEWAR TUTATI KYU NAHI !" This is the daily chart of Grasim. The stock made a high of 2900 in July 2024. The stock tested the same level 7 times since 15 months but unable to cross decisively above the resistance level.
On the lower end of the price move the stock is forming higher low resulting in formation of the ascendin

Grasim looking good for positional buyGRASIM has been consolidating near all time highs and poised for an upside break towards next target area 3400-3500 zone . Good investment bet with SL 2650 .
Cheers !

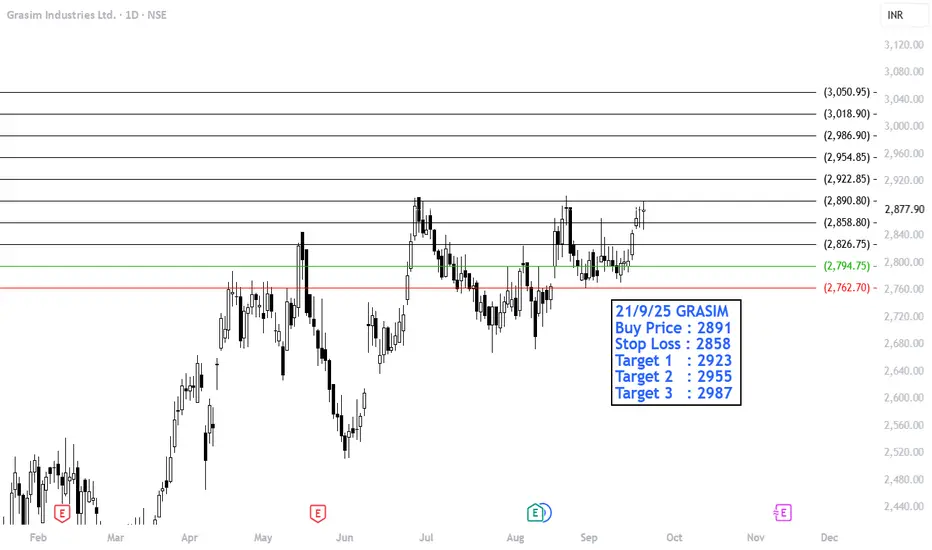
BUY GRASIM21/9/25 GRASIM
Buy Price : 2891
Stop Loss : 2858
Target 1 : 2923
Target 2 : 2955
Target 3 : 2987
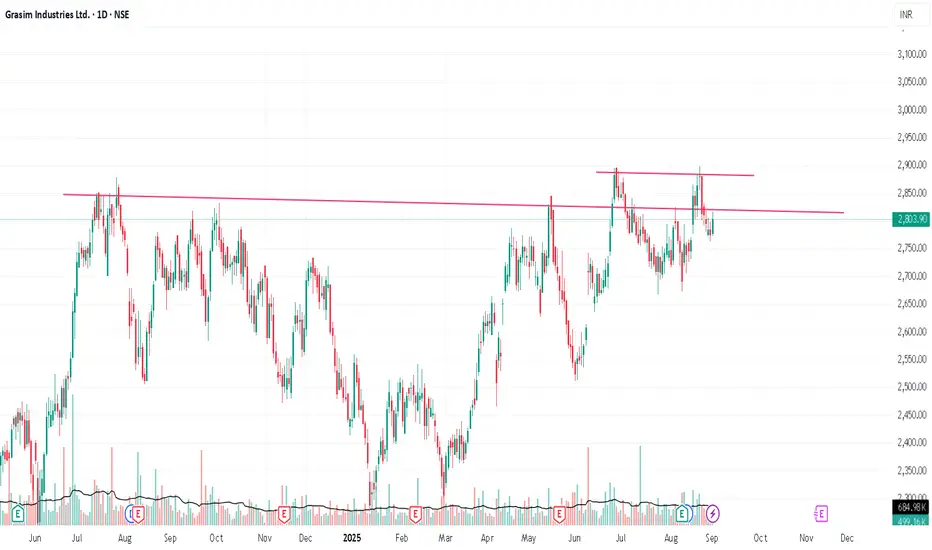
Flexing at All Time HighGrasim broke a cup & handle pattern and came down, again trying to break another trendline at top of the cup & handle pattern. if it breaks and sustain above the latest breakout with good volume, it'll move up for sure.
***This is only for educational purposes***
See all ideas
Summarizing what the indicators are suggesting.
Neutral
SellBuy
Strong sellStrong buy
Strong sellSellNeutralBuyStrong buy
Neutral
SellBuy
Strong sellStrong buy
Strong sellSellNeutralBuyStrong buy
Neutral
SellBuy
Strong sellStrong buy
Strong sellSellNeutralBuyStrong buy
An aggregate view of professional's ratings.
Neutral
SellBuy
Strong sellStrong buy
Strong sellSellNeutralBuyStrong buy
Neutral
SellBuy
Strong sellStrong buy
Strong sellSellNeutralBuyStrong buy
Neutral
SellBuy
Strong sellStrong buy
Strong sellSellNeutralBuyStrong buy
Displays a symbol's price movements over previous years to identify recurring trends.
763GIL27
Grasim Industries Limited 7.63% 01-DEC-2027Yield to maturity
—
Maturity date
Dec 1, 2027
699GIL31
Grasim Industries Limited 6.99% 04-APR-2031Yield to maturity
—
Maturity date
Apr 4, 2031
721GIL34
Grasim Industries Limited 7.21% 19-DEC-2034Yield to maturity
—
Maturity date
Dec 19, 2034
656GIL30
Grasim Industries Limited 6.56% 06-JUN-2030Yield to maturity
—
Maturity date
Jun 6, 2030
750GIL27
Grasim Industries Limited 7.5% 10-JUN-2027Yield to maturity
—
Maturity date
Jun 10, 2027
See all GRASIM bonds
Frequently Asked Questions
The current price of GRASIM is 2,943.60 INR — it has decreased by −1.22% in the past 24 hours. Watch Grasim Industries Ltd. stock price performance more closely on the chart.
Depending on the exchange, the stock ticker may vary. For instance, on NSE exchange Grasim Industries Ltd. stocks are traded under the ticker GRASIM.
GRASIM stock has risen by 3.88% compared to the previous week, the month change is a 5.60% rise, over the last year Grasim Industries Ltd. has showed a 19.66% increase.
We've gathered analysts' opinions on Grasim Industries Ltd. future price: according to them, GRASIM price has a max estimate of 3,600.00 INR and a min estimate of 2,960.00 INR. Watch GRASIM chart and read a more detailed Grasim Industries Ltd. stock forecast: see what analysts think of Grasim Industries Ltd. and suggest that you do with its stocks.
GRASIM reached its all-time high on Oct 29, 2025 with the price of 2,977.80 INR, and its all-time low was 16.65 INR and was reached on Apr 28, 1999. View more price dynamics on GRASIM chart.
See other stocks reaching their highest and lowest prices.
See other stocks reaching their highest and lowest prices.
GRASIM stock is 2.91% volatile and has beta coefficient of 1.15. Track Grasim Industries Ltd. stock price on the chart and check out the list of the most volatile stocks — is Grasim Industries Ltd. there?
Today Grasim Industries Ltd. has the market capitalization of 1.99 T, it has increased by 1.96% over the last week.
Yes, you can track Grasim Industries Ltd. financials in yearly and quarterly reports right on TradingView.
Grasim Industries Ltd. is going to release the next earnings report on May 22, 2026. Keep track of upcoming events with our Earnings Calendar.
GRASIM earnings for the last quarter are 11.80 INR per share, whereas the estimation was 5.35 INR resulting in a 120.56% surprise. The estimated earnings for the next quarter are −1.85 INR per share. See more details about Grasim Industries Ltd. earnings.
Grasim Industries Ltd. revenue for the last quarter amounts to 96.10 B INR, despite the estimated figure of 93.69 B INR. In the next quarter, revenue is expected to reach 99.09 B INR.
GRASIM net income for the last quarter is 10.37 B INR, while the quarter before that showed 5.53 B INR of net income which accounts for 87.29% change. Track more Grasim Industries Ltd. financial stats to get the full picture.
Yes, GRASIM dividends are paid annually. The last dividend per share was 10.00 INR. As of today, Dividend Yield (TTM)% is 0.34%. Tracking Grasim Industries Ltd. dividends might help you take more informed decisions.
Grasim Industries Ltd. dividend yield was 0.38% in 2024, and payout ratio reached 18.00%. The year before the numbers were 0.44% and 11.72% correspondingly. See high-dividend stocks and find more opportunities for your portfolio.
As of Feb 11, 2026, the company has 47.02 K employees. See our rating of the largest employees — is Grasim Industries Ltd. on this list?
EBITDA measures a company's operating performance, its growth signifies an improvement in the efficiency of a company. Grasim Industries Ltd. EBITDA is 395.77 B INR, and current EBITDA margin is 24.77%. See more stats in Grasim Industries Ltd. financial statements.
Like other stocks, GRASIM shares are traded on stock exchanges, e.g. Nasdaq, Nyse, Euronext, and the easiest way to buy them is through an online stock broker. To do this, you need to open an account and follow a broker's procedures, then start trading. You can trade Grasim Industries Ltd. stock right from TradingView charts — choose your broker and connect to your account.
Investing in stocks requires a comprehensive research: you should carefully study all the available data, e.g. company's financials, related news, and its technical analysis. So Grasim Industries Ltd. technincal analysis shows the buy rating today, and its 1 week rating is strong buy. Since market conditions are prone to changes, it's worth looking a bit further into the future — according to the 1 month rating Grasim Industries Ltd. stock shows the buy signal. See more of Grasim Industries Ltd. technicals for a more comprehensive analysis.
If you're still not sure, try looking for inspiration in our curated watchlists.
If you're still not sure, try looking for inspiration in our curated watchlists.