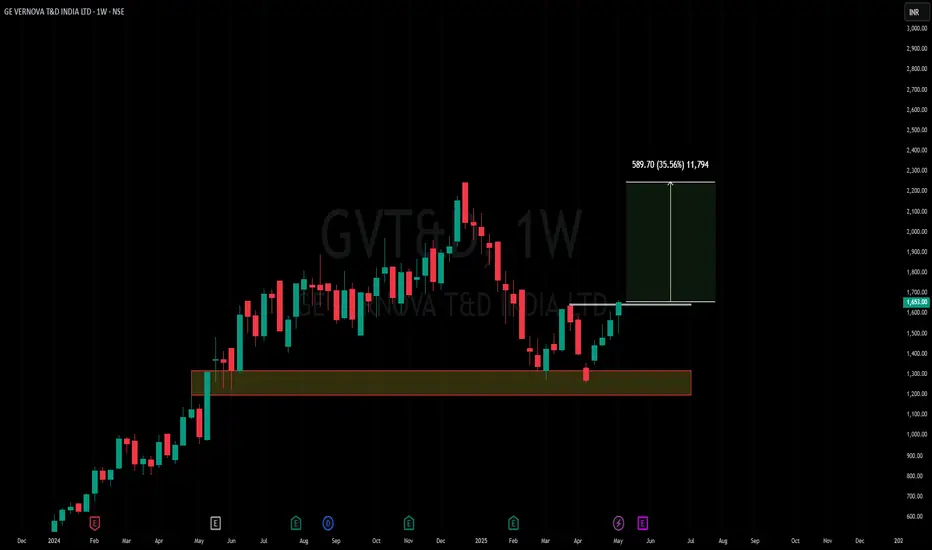
GVT&D Strong Bounce From Trendline — Key Resistance AheadGVT&D has taken strong support from the falling trendline, which has acted as a key demand zone in the past.
From this support area, price has bounced sharply and is now approaching the major horizontal resistance zone where sellers have previously stepped in multiple times.
This resistance remains
GE Vernova T&D India Limited
No trades
Next report date
—
Report period
—
EPS estimate
—
Revenue estimate
—
41.70 INR
6.08 B INR
42.92 B INR
123.63 M
About GE Vernova T&D India Limited
Sector
Industry
CEO
Sandeep Zanzaria
Website
Headquarters
Noida
Founded
1957
IPO date
Jun 30, 2008
Identifiers
2
ISIN INE200A01026
GE Vernova T&D India Ltd. engages in the business of building power transmission and distribution infrastructure. It also provides power electronics solutions and offers power management smart grid solutions for transmission and distribution including renewable energies integration. The company was founded on March 13, 1957 and is headquartered in New Delhi, India.
Related stocks

GVT&D 1 Week View 📊 Current context (end-Jan 2026):
The stock is trading near ₹3,100-₹3,200 levels recently.
📈 Resistance Levels (Upside Targets)
1. ~₹3,170 – ₹3,200
– Near recent intraday highs and short-term caps on rallies.
2. ~₹3,250 – ₹3,324
– Approaching the 52-week high zone (~₹3,323.8).
3. ~₹3,350 +
– Above

GVT&D Price ActionGE Vernova T&D India Ltd (GVT&D) has experienced a significant surge, with its stock price around ₹2,597 as of July 30, 2025. Over the past year, the stock delivered an impressive return of about 61%. Over three years, the returns are even more dramatic, exceeding 2,100%. However, the broader financ

GE Vernova T&D India – Q1 FY26 RESULTS + CHART ANALYSIS
## 🚀 GE Vernova T\&D India – Q1 FY26 RESULTS + CHART ANALYSIS
### 🔹 Fundamentals (Q1 FY26 – ended June 30, 2025)
* **Revenue**: ₹1,330 Cr, up **39% YoY** (₹958 Cr in Jun 2024)
* **EBITDA**: ₹388 Cr, up **113% YoY**, margin expansion to \~29%
* **Net Profit**: ₹291 Cr, up **116% YoY**
* **EPS**: ₹
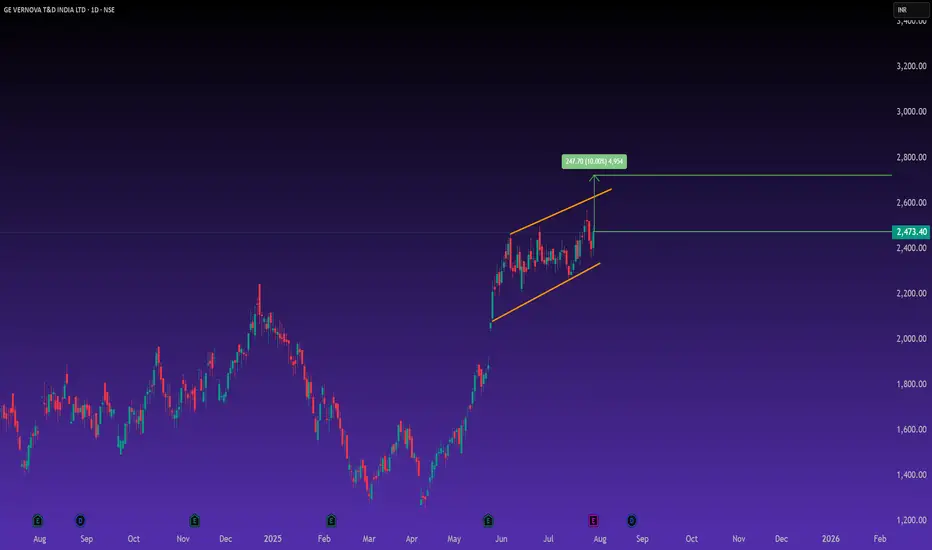
Amazing breakout on WEEKLY Timeframe - GVT&DCheckout an amazing breakout happened in the stock in Weekly timeframe, macroscopically seen in Daily timeframe. Having a great favor that the stock might be bullish expecting a staggering returns of minimum 25% TGT. IMPORTANT BREAKOUT LEVELS ARE ALWAYS RESPECTED!
NOTE for learners: Place the break
GVT&DGVT&D giving trendline breaout with increased volume. Coming out of the zone and seems ready for the next run. Keep it on radar.

See all ideas
Summarizing what the indicators are suggesting.
Neutral
SellBuy
Strong sellStrong buy
Strong sellSellNeutralBuyStrong buy
Neutral
SellBuy
Strong sellStrong buy
Strong sellSellNeutralBuyStrong buy
Neutral
SellBuy
Strong sellStrong buy
Strong sellSellNeutralBuyStrong buy
An aggregate view of professional's ratings.
Neutral
SellBuy
Strong sellStrong buy
Strong sellSellNeutralBuyStrong buy
Neutral
SellBuy
Strong sellStrong buy
Strong sellSellNeutralBuyStrong buy
Neutral
SellBuy
Strong sellStrong buy
Strong sellSellNeutralBuyStrong buy
Displays a symbol's price movements over previous years to identify recurring trends.
Frequently Asked Questions
The current price of GVT&D is 3,489.00 INR — it has increased by 0.09% in the past 24 hours. Watch GE Vernova T&D India Limited stock price performance more closely on the chart.
Depending on the exchange, the stock ticker may vary. For instance, on NSE exchange GE Vernova T&D India Limited stocks are traded under the ticker GVT&D.
GVT&D stock has risen by 14.97% compared to the previous week, the month change is a 14.15% rise, over the last year GE Vernova T&D India Limited has showed a 99.94% increase.
We've gathered analysts' opinions on GE Vernova T&D India Limited future price: according to them, GVT&D price has a max estimate of 5,000.00 INR and a min estimate of 3,141.00 INR. Watch GVT&D chart and read a more detailed GE Vernova T&D India Limited stock forecast: see what analysts think of GE Vernova T&D India Limited and suggest that you do with its stocks.
GVT&D stock is 5.36% volatile and has beta coefficient of 1.66. Track GE Vernova T&D India Limited stock price on the chart and check out the list of the most volatile stocks — is GE Vernova T&D India Limited there?
Today GE Vernova T&D India Limited has the market capitalization of 898.61 B, it has increased by 9.97% over the last week.
Yes, you can track GE Vernova T&D India Limited financials in yearly and quarterly reports right on TradingView.
GE Vernova T&D India Limited is going to release the next earnings report on May 30, 2026. Keep track of upcoming events with our Earnings Calendar.
GVT&D net income for the last quarter is 2.91 B INR, while the quarter before that showed 2.99 B INR of net income which accounts for −2.90% change. Track more GE Vernova T&D India Limited financial stats to get the full picture.
Yes, GVT&D dividends are paid annually. The last dividend per share was 5.00 INR. As of today, Dividend Yield (TTM)% is 0.14%. Tracking GE Vernova T&D India Limited dividends might help you take more informed decisions.
GE Vernova T&D India Limited dividend yield was 0.32% in 2024, and payout ratio reached 21.05%. The year before the numbers were 0.24% and 28.28% correspondingly. See high-dividend stocks and find more opportunities for your portfolio.
As of Feb 6, 2026, the company has 2.26 K employees. See our rating of the largest employees — is GE Vernova T&D India Limited on this list?
EBITDA measures a company's operating performance, its growth signifies an improvement in the efficiency of a company. GE Vernova T&D India Limited EBITDA is 14.91 B INR, and current EBITDA margin is 19.49%. See more stats in GE Vernova T&D India Limited financial statements.
Like other stocks, GVT&D shares are traded on stock exchanges, e.g. Nasdaq, Nyse, Euronext, and the easiest way to buy them is through an online stock broker. To do this, you need to open an account and follow a broker's procedures, then start trading. You can trade GE Vernova T&D India Limited stock right from TradingView charts — choose your broker and connect to your account.
Investing in stocks requires a comprehensive research: you should carefully study all the available data, e.g. company's financials, related news, and its technical analysis. So GE Vernova T&D India Limited technincal analysis shows the buy rating today, and its 1 week rating is strong buy. Since market conditions are prone to changes, it's worth looking a bit further into the future — according to the 1 month rating GE Vernova T&D India Limited stock shows the strong buy signal. See more of GE Vernova T&D India Limited technicals for a more comprehensive analysis.
If you're still not sure, try looking for inspiration in our curated watchlists.
If you're still not sure, try looking for inspiration in our curated watchlists.