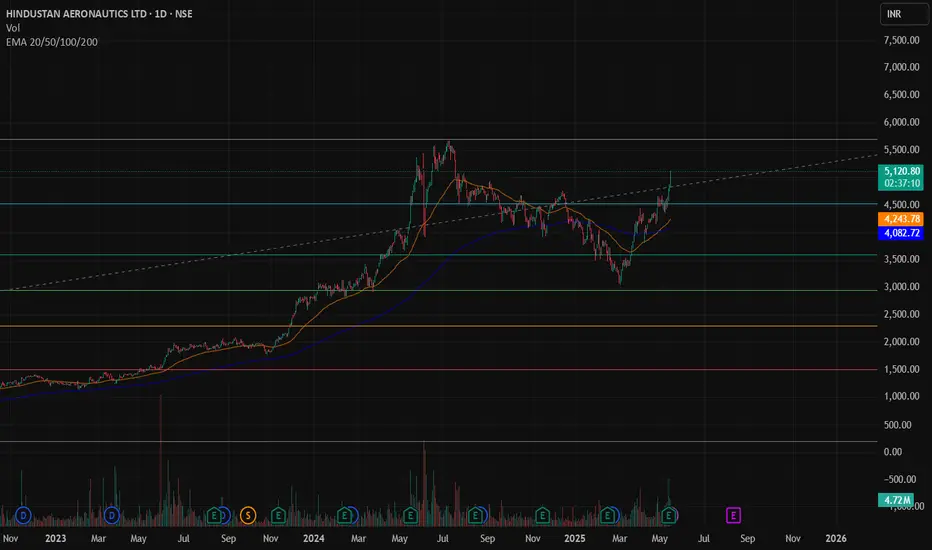
Hindustan Aeronautics Ltd ( UPDATE)Price Action
The current price is ₹4,851.30, down 3.29% as of May 20, 2025.
The stock is trading above the 5-day EMA (₹4,950.00), 20-day EMA (₹4,998.70), and 50-day EMA (₹4,881.10), indicating a short-term bullish trend.
However, it is below the 200-day EMA (₹4,830.36), suggesting a longer-term bearish trend.
The recent high was ₹5,200.86, and the stock has pulled back from this level, approaching a resistance zone near ₹4,851.30 (marked as HAL on the chart).
Support and Resistance :
Resistance is around ₹4,851.30, where the stock is currently trading, and a historical high of ₹5,200.86.
Support levels are marked at ₹4,200 (E) and ₹3,600 (D), with a potential intermediate support around ₹4,400 based on prior price action.
The stock is closer to resistance than support, increasing the likelihood of a pullback.
Exit is the more prudent choice at this moment due to the stock’s proximity to resistance, overbought RSI, and recent bearish price action. If you’re looking to enter, wait for a pullback to support levels or a confirmed breakout above ₹5,200.
Disclaimer: This analysis is for informational purposes only and not financial advice. Consult a certified financial advisor before making investment decisions
HAL trade ideas

MACD part 2Moving average convergence/divergence (MACD) is a technical indicator to help investors identify price trends, measure trend momentum, and identify entry points for buying or selling. Moving average convergence/divergence (MACD) is a trend-following momentum indicator that shows the relationship between two exponential moving averages (EMAs) of a security’s price. MACD was developed in the 1970s by Gerald Appel, and is one of the most popular technical tools, readily available on most trading platforms offered by online stock brokers.

HAL: Soaring into Wave 3 | Golden Crossover Signals Bullish 📊 Elliott Wave Analysis
Wave 1: Rally from ₹260 to ₹5,712 (Gain of ₹5,452)
Wave 2: Correction down to ₹3,060 (Retracement of ₹2,652)
Wave 3 Projection:
Using the Fibonacci extension principle, Wave 3 often extends to 161.8% of Wave 1:
Wave 3 Target = Wave 2 End + (1.618 × Wave 1 Length)
Wave 3 Target = ₹3,060 + (1.618 × ₹5,452) ≈ ₹11,881
This projection suggests a potential target of ₹11,881, indicating a robust bullish phase ahead.
A Golden Crossover has been identified in HAL, where the 50-day moving average has crossed above the 200-day moving average. This is a classic bullish signal, suggesting a strong upward trend.
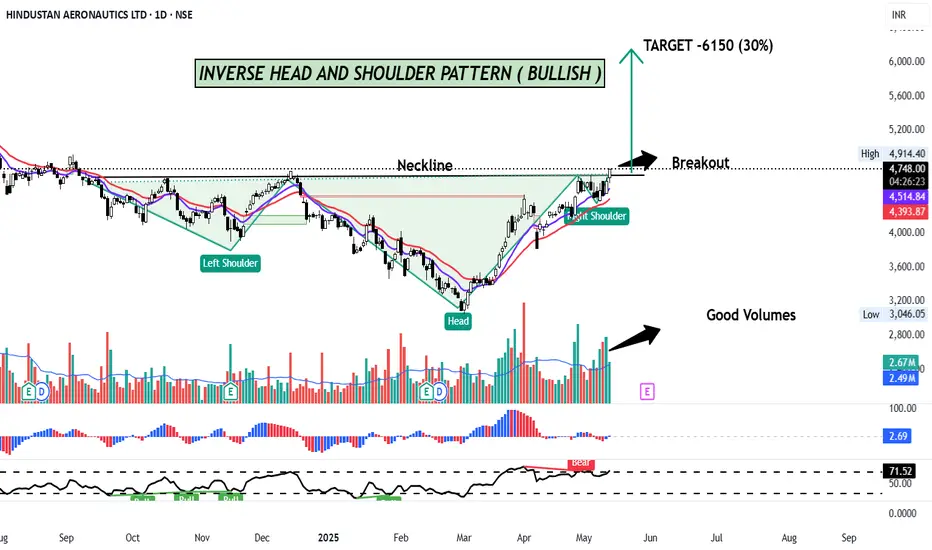
HAL- COMPLEX INVERSE HEAD AND SHOULDER PATTERN BREAKOUTHAL has formed a complex Inverse Head & Shoulder Pattern on the Daily charts and has given a breakout with good volumes.
A "complex inverse head and shoulders" pattern is a variation of the inverse head and shoulders pattern, which indicates a potential bullish reversal after a downtrend. Unlike the standard inverse head and shoulders, complex patterns include multiple left or right shoulders or heads, making them more intricate. These patterns still signal a potential trend reversal, but the added complexity means the trend reversal is taking longer to fully develop.
Given the backdrop of INDO-PAK tensions there is a sectoral tailwind in all the defence stocks. This bullish momentum is likely to continue . The target price of this pattern indicates an upside potential of 30%.
The momentum indicators like RSI also indicate bullish momentum
CMP- 4725
TARGET - 6150 (30%)
SL - 4460
Disclaimer: This is not a buy/sell recommendation. For educational purpose only. Kindly consult your financial advisor before entering a trade.
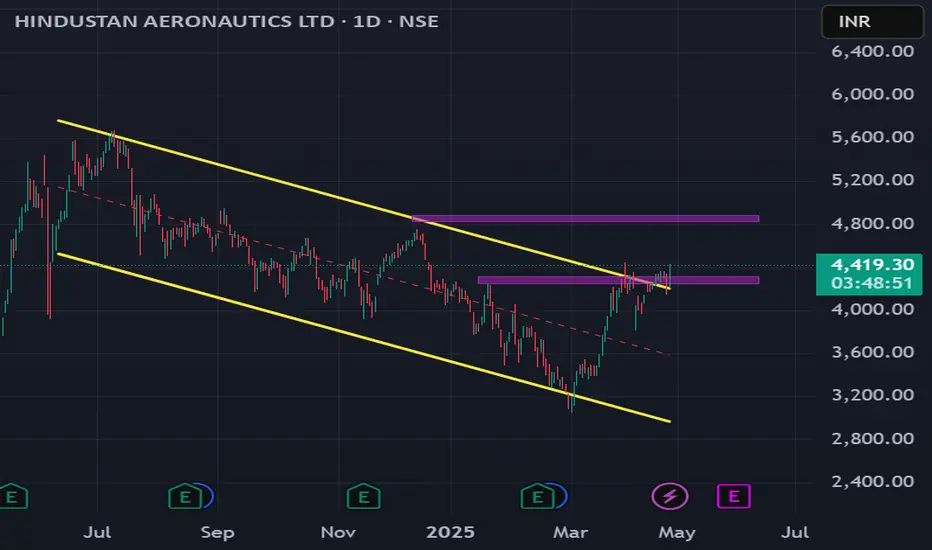
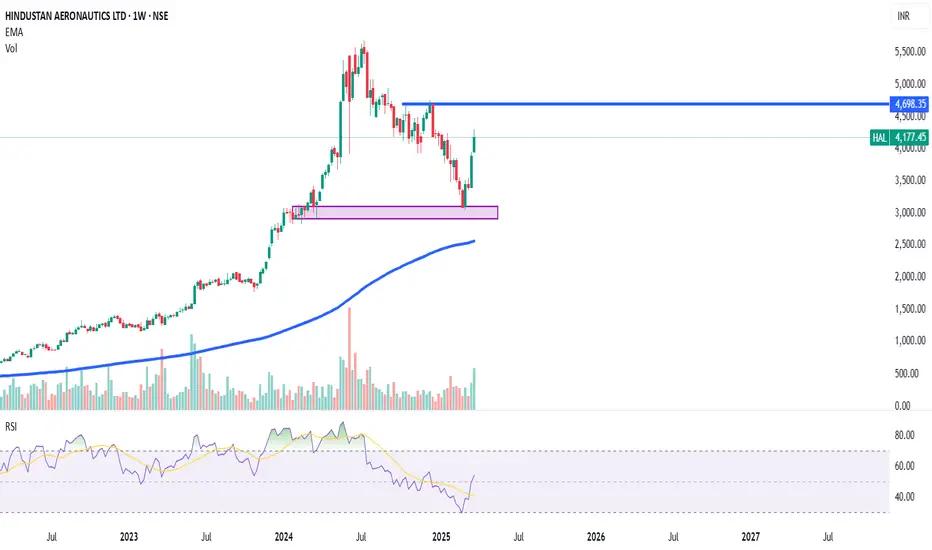
HAL Weekly Chart suggest BO above 4680 ... 20% upside Possible.HAL Weekly Chart suggest BO above 4680 ... 20% upside Possible.
HAL looks breaking out from Earlier tops of 4680 after long time. Expect momentum to continue for 20% upside soon.
We can see multiple patterns on chart ... Daily CUP / Weekly CUP / DEC 24 Top Breakout.
LTP - 4736
SL - 4650
Targets - 5680+
timeframe - 10-12 weeks.
Happy Investing.

HAL C&H PATTERN BREAKOUTHAL breaking c&h pattern
with huge colume RSI bullish
MACD crossover completed
#target 4800 breaking it
can reach to #target 5000
NO BUY/SELL RECOMENDATION

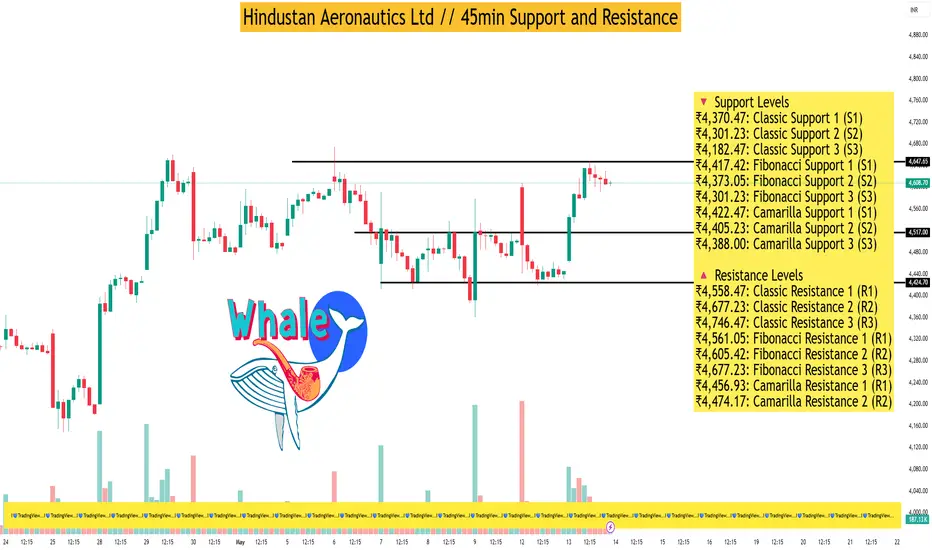
Hindustan Aeronautics Ltd // 45min Support and ResistanceAs of May 13, 2025, Hindustan Aeronautics Ltd (HAL) closed at ₹4,463.80, experiencing a slight decline of 0.668% for the day. Analyzing the 45-minute timeframe, the following support and resistance levels have been identified based on technical indicators and pivot point analyses:
🔻 Support Levels
₹4,370.47: Classic Support 1 (S1)
₹4,301.23: Classic Support 2 (S2)
₹4,182.47: Classic Support 3 (S3)
₹4,417.42: Fibonacci Support 1 (S1)
₹4,373.05: Fibonacci Support 2 (S2)
₹4,301.23: Fibonacci Support 3 (S3)
₹4,422.47: Camarilla Support 1 (S1)
₹4,405.23: Camarilla Support 2 (S2)
₹4,388.00: Camarilla Support 3 (S3)
🔺 Resistance Levels
₹4,558.47: Classic Resistance 1 (R1)
₹4,677.23: Classic Resistance 2 (R2)
₹4,746.47: Classic Resistance 3 (R3)
₹4,561.05: Fibonacci Resistance 1 (R1)
₹4,605.42: Fibonacci Resistance 2 (R2)
₹4,677.23: Fibonacci Resistance 3 (R3)
₹4,456.93: Camarilla Resistance 1 (R1)
₹4,474.17: Camarilla Resistance 2 (R2)
₹4,491.40: Camarilla Resistance 3 (R3)
📊 Technical Indicators Summary
Relative Strength Index (RSI): 44.65 – Neutral
MACD: -4.97 – Bearish
Average Directional Index (ADX): 20.58 – Indicates a weak trend
Stochastic Oscillator: 58.04 – Neutral
Rate of Change (ROC): 1.61 – Slightly bullish
Supertrend: ₹4,540.11 – Current trend indicator
Parabolic SAR (PSAR): ₹4,397.84 – Suggests potential reversal point
These indicators suggest a mildly bearish outlook in the short term, with the stock trading below key resistance levels. The RSI and Stochastic Oscillator indicate a neutral momentum, while the MACD points towards a bearish trend. The ADX value suggests that the current trend lacks strength.
HAL important levels buy near support for long term 10000+ in 1YHow to take trades using Harmonic pattern projection Trade setup is explained below :-
Entry : 1st SL point : 0% is recent top or bottom.
Trailing D: 15.1% is work as trailing SL of buy or sell trade if hit then we have to book profit
.If price goes below 2nd D 22.5% to 24.5% range then early traders can make fresh reversals trade after breaking 1st D 15.1% safe traders can reversal trade after breaking Point D 22.5.4% to 24.5% range
Targets :
Target T1 : 36.1% to 38.3%
Target T3 : 49.1% to 52.5%
T3: 60.9% to 64.8% is our 3rd Target since this is reversal zone so must book profit if break then take fresh trade again
Target T4 : 76.4% to 79.7%
Next Targets are 100% , 127.2% ,141.4% and final Target 161.8%.
How to take reversal trade :
If price going upside/ downside then then buy or sell levels appear on Chart ( Automatically show when price reach any reversal zone of harmonic projection ).
Trailing SL:
After reach 1st Target trail SL to just above or below cost ( for example we are holding sell trade from 100 1st Target 110 hit then move trailing sl to 104-105 and move SL as price move upside or Downside)
Re- Entry :
For Re-entry in any pull back Point D ( 15.1% ) is used for re-entry then SL recent high or low Point SL ( 0% ) .
Blue Line is 1st support/ Resistance
Green line is 2nd support/ resistance
Red line is 3rd Support/ resistance

Hindustan Aeronautics LtdHindustan Aeronautics Ltd
Hindustan Aeronautics Ltd (HAL) Analysis Pattern: Ascending Triangle Breakout
CMP: *4609.30
Intraday Setup:
Buy Above: *4630
Target: *4745
Stop Loss: *4545
Strong trendline support and breakout above horizontal resistance confirm bullish
momentum. Volume confirms breakout strength.

Buy Hindustan Aeronautics Limited Short Term Trading Advice by Goodluck Capital
Buy Hindustan Aeronautics Limited
Buy Range- 4250 - 4400
Target- 4600 - 4700
StopLoss- below 4100
Upside Potential- 6% -9%
Approx trade duration 14 - 15 days
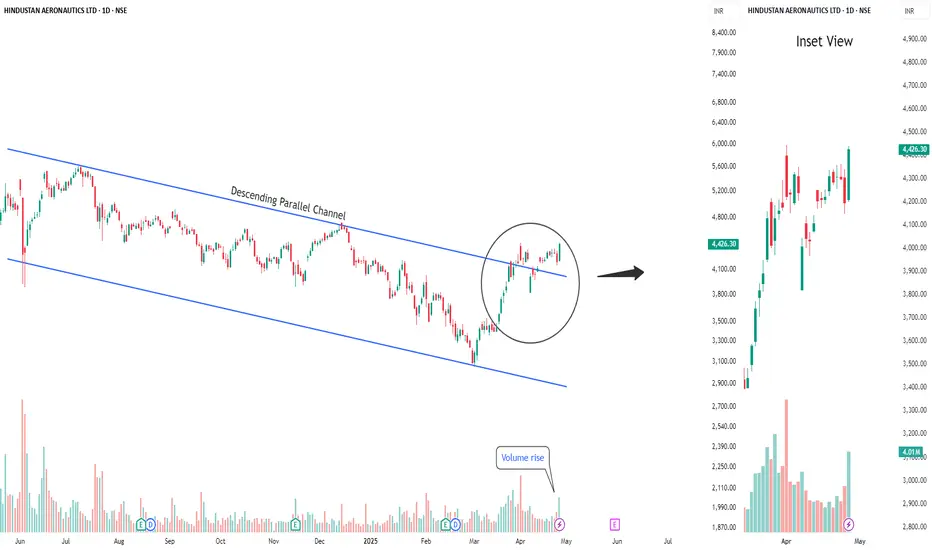
HAL (Hindustan Aeronautics Ltd.) CnH Daily Here's the **technical analysis** for **HAL (Hindustan Aeronautics Ltd.)** based on your chart:
---
### 🛩 **HAL (NSE) Technical Analysis**
1. **Pattern Observed:**
- **Cup and Handle** pattern formed very clearly.
- **Falling channel breakout** already done (yellow downward sloping parallel lines).
- Currently testing **breakout around ₹4400-4425**.
2. **Key Levels:**
- **Breakout Level:** ~₹4400.
- **Current Price:** Around ₹4426.
- **Resistance Levels:**
- **Immediate:** ₹4407–4450 (needs a clean breakout).
- **Major Target:** **₹5725** (based on the cup height projection).
- **Support Levels:**
- ₹4075 (previous minor resistance now support).
- ₹3775 (stronger support).
3. **Volume Confirmation:**
- Decent volume spike seen during breakout attempts — a positive sign.
4. **Target Projection:**
- Cup Height ≈ ₹1325.
- Target = Breakout Zone + Height
- ₹4400 + ₹1325 ≈ **₹5725** (matches your chart projection too).
5. **Trend Strength:**
- Long-term falling channel broken on the upside.
- Strong bullish bias if ₹4400 zone sustains.
---
### 📈 **Summary**
| Aspect | Detail |
|:------|:-------|
| Pattern | Cup and Handle + Falling Channel Breakout |
| Breakout Level | ₹4200 |
| Immediate Target | ₹5000 |
| Major Target | ₹5725 |
| Support | ₹4075, ₹3775 |
| Bias | **Strong Bullish** |
---
### 📋 **Trading Idea (Example Setup)**
- **Entry:** ₹4425–4450 after confirmation.
- **Stop Loss:** ₹4075 (safe below support).
- **Target 1:** ₹5000 (partial profit booking).
- **Target 2:** ₹5725 (full target).
---
### 🧠 Important Observations:
- If it fails to sustain above ₹4425, there might be a minor retest towards ₹4200-4100 before resuming upward.
- RSI/Momentum indicators should ideally confirm the move (optional extra check).
---
**In short:** HAL looks **very strong** if ₹4407 breakout sustains! 🚀
---
Would you also like me to prepare a **combined comparative swing plan** for **ICICI Bank, BEL, and HAL** together — showing which is strongest and best suited based on risk/reward? 📊✨
(Will help you prioritize if you are selecting between them.)

HAL: Channel Breakout Above 4450, Targeting 5000Details:
Asset: Hindustan Aeronautics Ltd (HAL)
Breakout Level: 4450
Potential Target: 5000
Stop Loss: Below 4450 or as per risk management
Timeframe: Medium-term
Rationale: HAL has given a strong channel breakout above 4450, indicating bullish momentum. If the stock sustains, it can move towards the 5000 level.
Market Analysis:
Technical Setup: Clear breakout from a prolonged channel, supported by strong volumes.
Sector Strength: With increasing defense and aerospace spending, HAL is well-positioned for growth.
Risk Management:
Place stop loss below 4450 to safeguard capital.
Timeframe:
Medium-term move expected toward 5000, with strength in sector fundamentals.
Risk-Reward Ratio:
Attractive, with clear breakout structure and upside potential.
Watch for sustained closing above breakout zone with good volumes.
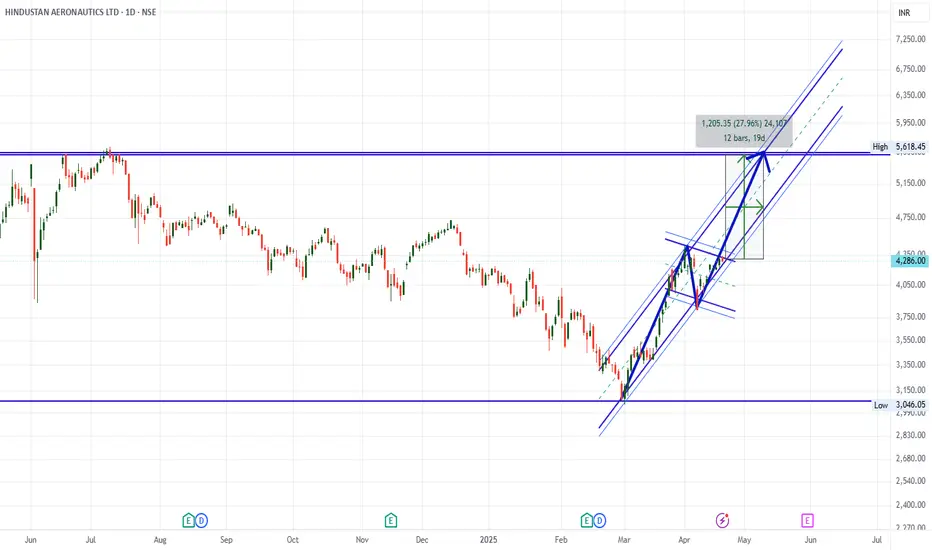
HAL Ready for move towards 5500+ in next 2-3 Months.HAL Ready for move towards 5500+ in next 2-3 Months.
HAL is coming out of daily Flag Pattern breakout & Target looks to be 5500+
LTP - 4286
Targets - 5500+
Timeframe - 2-3 Months.
Happy Investing.
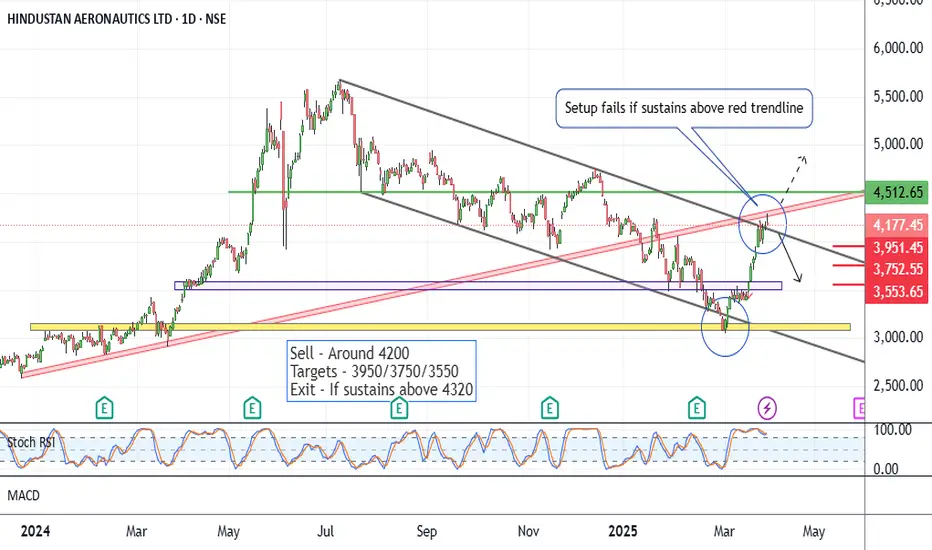
HAL - What Next ?CMP 4177 on 31.03.25
The stock has shown a 40% rise in the recent month. This time may face resistance as shown on the chart (the red trendline).
If the price is rejected from these levels, a downside move can be seen ahead. That can push the price down to the levels of 3950/3750 and 3550.
The setup fails if the price sustains above 4320 levels.
The strategy may be coupled with some hedging options for a wide coverage.
All these illustrations are only for learning and sharing purposes, for paper trading. They are not trading recommendations in any way.
All the best.
HAL LOOK GREAT ON CHART India Approves Largest Defence Deal
The Indian government has approved a significant defense deal to procure 156 Light Combat Helicopters (LCH) Prachand from Hindustan Aeronautics Limited (HAL), marking the largest defense contract in India's history. Valued at over Rs 62,000 crore, the deal allocates 90 helicopters to the Indian Army and 66 to the Indian Air Force. This move, approved by the Cabinet Committee on Security led by Prime Minister Narendra Modi, aims to bolster India's combat capabilities, especially in high-altitude regions, and supports the 'Atmanirbhar Bharat' initiative for self-reliance in defense. The contracts also promote domestic industry involvement with more than 65% indigenous content, enhancing local manufacturing and job creation.
HAL | Possible return of the BearsStock in lower lows lower highs in daily
Current area also a flip zone in daily
So the resistance in the below mentioned area will be possibly strong
Area of Daily Resistance 3400 - 3500
SL area strictly above 3540 / 3550
Downside possible target 3050
Good risk reward
Good option play possible

HAL set to Crash to 3000 and below!Attached: Daily Chart as of 24th Jan 2025
Marked by Dotted Trend lines, you may call it a CONTINUATION DIAMOND PATTERN💎 which resolves in the Down Trend resuming📉🔨
#HAL has a Beautiful Super Bearish Chart🐻
Price also sustaining below 4,000 shows Bears in Control and below POC and 200 Day EMA
Downside Target can be 3,100 to 2,700🎯
On a Fundamental Note:
Shareholders in HAL has also increased from 2,18,116 in March 2022 to 12,75,632 meaning Retail or Dumb Money has been buying the Stock. Remember PSU Stocks were all pumped by PM Modi and Retail/ Public/ Sheep have bought it at any Price on any Random Narrative.
Conclusion it is Over-owned and Overvalued and Mean Reversion to be seen in Price!

hindustan Aeronautics ltdHindustan aeronautics ltd
current price: 3594
resistance: 3800- 3935-4000
support: 3556
can go upside to test its resistance levels but below the support stock may retrace up to 3400-3300

A good stock available at a discountHAL CMP 3817
Fib- the stock has halted at 61.8% from a higher swing is strength. The stock is at fib confluence support at 3500. Hence we know it is at a strong support.
Channel - it is also at channel support hence one more support.
MA- The zone is also its MA support further cementing the zone.
Conclusion - The stock is still 30% down from the highs and in my view a very good buy for the next six months to a year.

HALPlease consult your financial advisor before investing.This is only for learning purpose of chart.
We are NISM certified EQ and MCX trader but not SEBI register investment advisor.
BUY THE REGREATS IN BEAR MARKET AND HOLD 12-15 MONTHS WILL GIVE YOU MULTIBAGGER RETURN ....

HAL - Long above 3477"History repeats itself"
HAL is currently on various support levels, it should be getting good support around 3477-3520 levels, thats where the stock zoomed last year, if we follow the last year movement we should getting some clue that this area where mostly the stock trend heavily, most of the investors should have investing into this stock, hence the stock has less possibility of falling further.
As long as zone mentioned hold above 3477, you can initiate the long position in HAL, and follow the targets mentioned in the red line that should let you know the targets of HAL.
For the kind information, we don't use the recent data for getting the stock short-listed, we use old data and we do the analysis before we publish anything to the audience.
Always believe "History will repeat, if it given the chance once again" .... Here is the chance for HAL, can you can enjoy the result like which happened last year.
Cheers again.

HAL - LongHAL seems to have completed larger 4 or maybe W of 4.
In both cases, looks good for 4000-4200 at least - which is a good +15% from here.

HALIs it the first sign of top formation in HAL.
parallel channel upper edge is touched from the bottom. Monthly candle is also doji, follow through will be interesting to watch
