HARIOM PIPESHARIOM PIPES
Weekly 78% Retracement with Band Expanding After Squeeze (Ungli)
On Daily HL HH UNGLI Todays Open Low Same Rising Vol
Tgt 540-640 (Study Purpose)
Trade ideas

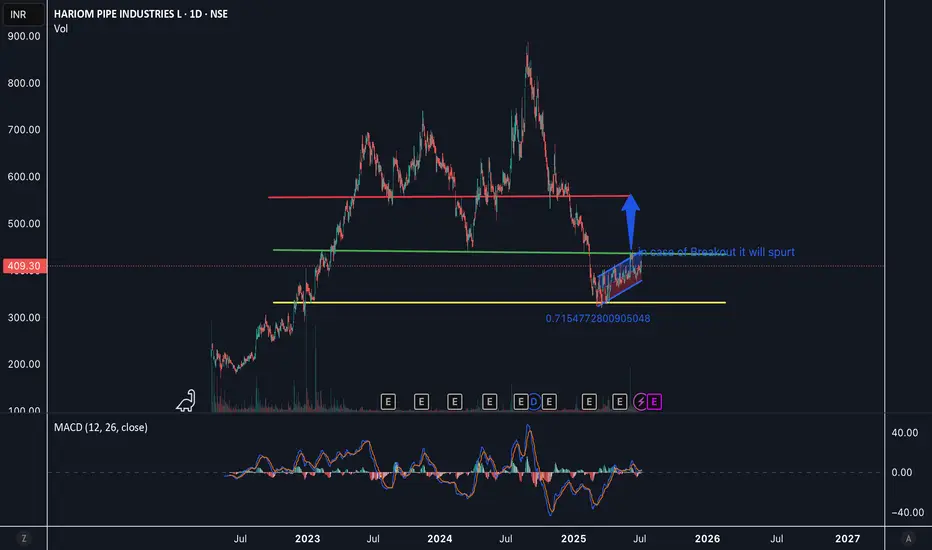
Hariom pipesA clear case of spurt is expected in Jul and Aug and by end of Aug it may reach 550. Its for Educative purpose only
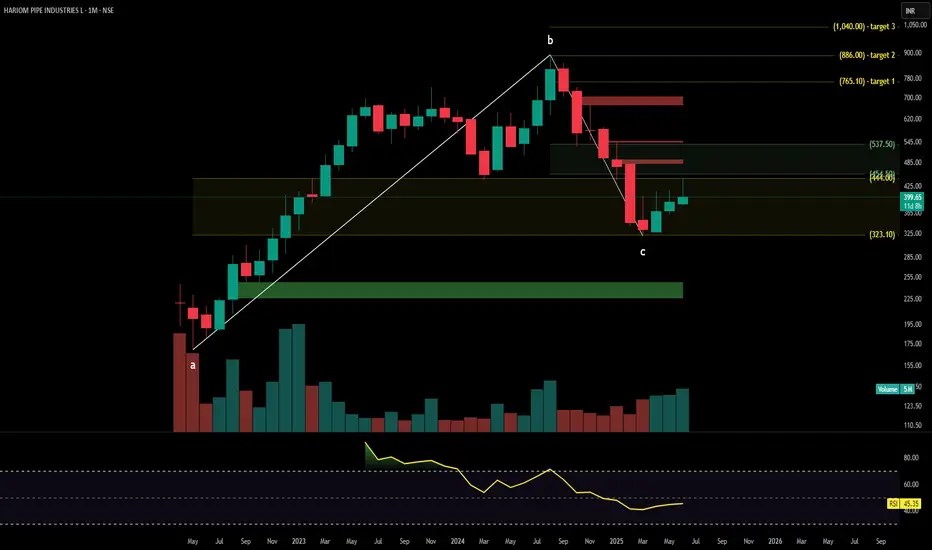
HARIOM PIPES technoFunda analysisHariom Pipe Industries Ltd. (NSE: HARIOMPIPE) is currently trading at INR 399.65, reflecting a 2.70% gain. The company specializes in manufacturing MS pipes, scaffolding structures, and steel tubes, catering to industries such as construction, infrastructure, and engineering.
Key Levels
Support Levels: INR 323.10, INR 399.65
Swing Level: INR 414.68
Possible Upside Levels: INR 537.50, INR 765.10, INR 886.00, INR 1,040.00
Technical Indicators
RSI: The Relative Strength Index (RSI) is at 45.35, indicating neutral momentum, meaning the stock is in a consolidation phase before a potential trend shift.
Volume: Trading volume is moderate, suggesting consistent investor participation. A volume surge near key levels could validate a breakout.
Sector and Market Context
Hariom Pipe Industries Ltd. operates in the steel and infrastructure materials sector, which has seen steady demand growth, supported by government-led infrastructure projects and private construction expansion. The industry benefits from rising urbanization, industrial investments, and the need for durable piping solutions. However, factors such as raw material price volatility, global steel pricing trends, and competition from larger industrial players could influence the company’s long-term growth prospects.
Latest News and Developments
Market Trends: Positive sentiment toward steel manufacturers, driven by increased public and private sector construction spending.
Analyst Ratings: Some analysts maintain a stable outlook, citing consistent order inflows and operational efficiency.
Quarterly Results: Recent earnings reports highlight steady revenue growth, backed by higher demand for MS pipes and steel fabrication materials.
Dividend Update: Hariom Pipe Industries Ltd. has declared a dividend payout of ₹4 per share, reinforcing its commitment to shareholder returns.
Analysis Summary
Hariom Pipe Industries Ltd. exhibits neutral technical signals, with RSI and price action suggesting potential accumulation before a breakout. The stock benefits from sector tailwinds, driven by strong infrastructure investments and steady demand for industrial piping solutions, though market risks such as raw material costs and pricing competition should be monitored. Investors should track price movements near resistance levels, volume trends, and broader industry updates before making strategic decisions.
HariOm Pipes - Bottoming outA stock that's got capex come online and the management is extremely bullish about its prospects going ahead.
They say they'll do a topline of 1600cr this year and 2500 next financial year..
The chart seems to be showing a bottoming out pattern too with a positive divergence on the RSI.
Long and current price with another buy above 591 with a Stoploss below 545.
There will be a higher high plus trendline breakout above 600.
There can be another pyramid above 630 if and when the stock takes out the 200EMA.

Hari Om Pipe Short Term TradeThe level around 528 is a long term support
After reversing from that level, there has been a surge in volume
The stock is currently showing a lot of bullish strength
It shows a possibilty of breaking through further resistances
yellow horizontal lines indicate further resistances
For a short term trade,
tgt 696, sl 613.5

HARIOMPIPE - Retest at Cup and Handle Breakout🔊 HARIOMPIPE - Retest at Cup and Handle Breakout
HARIOMPIPE - HARIOM PIPE INDUSTRIES
⌛Duration - Short Term (3 month to 6 month)
📊📈 Trade Logic - Retest at Cup and Handle Breakout
CMP - ₹764.4
Time Frame - Daily
🎯Target 1 : ₹850
🎯Target 2 : ₹900
🎯Target 3 : ₹950
🎯Target 4 : ₹1000
🛑 Stop : ₹680
🏆 Risk/Reward Ratio (1: 2.75)
Disclaimer: The stock information shared here is not a recommendation to buy, sell, or hold. It reflects my own analysis and is intended solely for educational purposes. Any actions you take based on this information are your responsibility, and the admin of this channel is not liable for any financial gains or losses. Please consult a financial advisor before making any investment decisions. I am not a SEBI-registered advisor.

Hariom Pipe CnH and RetestHeadquartered in Hyderabad, Telangana, Hariom Pipe Industries Limited is an integrated steel manufacturer with a stronghold in the South Indian market. It hasa diverse product portfolio consisting of Mild Steel (MS) Billets, Pipes and Tubes, Hot Rolled (HR) Coils, and Scaffolding Systems.
Technically chart is forming CnH Pattern and retested the BO levl of 740. Currently hovering around 760. The CnH pattern is showing a tgt of 1000+
FII holding increasing, Good sales growth and ROCE. overall good fundamentals.
The only negative is increasing debt. Please do ur own analysis before investing.

Short term trading opportunity in Hariom Pipe for > 15% upsideHi,
NSE:HARIOMPIPE has given a Bullish Flag Breakout on Daily charts with very good volume.
MACD is also on the bullish side on Weekly time frames. RSI is also on the bullish side on daily, weekly and monthly time frames.
In the current market scenario, I am expecting that the bullish momentum will continue.
Complete price projection like entry, stop loss and targets mentioned on the charts for educational purpose.
Don't Forget to Follow me to get all the updates.
Please share your feedback or any queries on the study.
Disclaimer: Please consult your financial advisor before making any investment decision.

HARIOM PIPE INDUSTRIES LTD - BREAKOUT RETEST CANDIDATEHariom pipe industries after stellar run shown some correction and consolidation.
On charts CUP & HANDLE breakout can be clearly seen.
This stock can reach in 4 digits soon.
One can add at CMP & on dips after own analysis.

HARIOMPIPE - HARIOM PIPE INDUSTRIESHARIOMPIPE - HARIOM PIPE INDUSTRIES
Trade Type - Short Term (2 month to 8 month)
Trade Logic - VCP Chart Pattern Breakout
CMP - 774.50
Time Frame - Daily
Target 1 : 830
Target 2 : 870
Target 3 : 930
Target 4 : 1000
Stop : 690
Risk/Reward Ratio (1: 2.6)
Disclaimer: The stock information shared above is not a recommendation to buy, sell, or hold. It reflects my own analysis and is intended solely for educational purposes. Any actions you take based on this information are your responsibility, and the admin of this channel is not liable for any financial gains or losses. Please consult a financial advisor before making any investment decisions. I am not a SEBI-registered advisor.

structure break in harriom pipes entry : 696 target 10 % stock is in good consolidation and we got an entry today breaking week high

Hariom Pipes: LongBullish engulfing on daily charts
Good results with hope of operating leverage to kick in next few quarters

HARIOMPIPE bullish; above 747 ? - Tuesday 13th Aug.HARIOMPIPE: Bullish if ~ 39-weeks long consolidation range is broken on good volumes and sustains.
The above information does not constitute investment/trading recommendation and it is purely for educational purpose....
INTRADAY Trading Strategy in 3 stages of breakouts:
1) Impulse upmove stage: The strong upmove (nearly upto 1.5% from trigger-price) happens within five minutes. "High Risk Traders" buy on breakouts in hope of continuation of upmove. "High Risk Traders" may have to patiently wait through the Pullback-Consolidation stage to realize profits. High risk:High reward set up as breakouts may fakeout (reversal)also
2) Pullback-Consolidation stage: After the above "Impulse upmove stage"; the price may then pull back and move sideways (between "Open" price and "High" of the above "Impulse upmove stage"). "Safe traders" with minimum risk profile wait for a breakout from the consolidation stage to enter into trade , to book high profits in the final "Breakout continuation" stage
3) Breakout continuation: Stocks often in the third stage breaks up above the "High" of the first "Impulse upmove stage" and continue to go higher again.(another 2-3%)
Both Safe Traders/High Risk Traders book profits at this stage
SWING Trading Strategy:
Position is kept open, only upon stock closing above the entry price on day closing basis and is held on for 5-10 trading sessions for larger gains (5-10%)
The above information do not constitute, financial, investment, trading, or other types of advice or recommendation. It is purely for educational purpose....


Buy Hariompipe for a target of 700
Hariompipe has given break out in parabolic sar and has bounced from important Fibonacci level, expecting the move to be fast to 700
Buy Hariompipe for a target of 700 in 5-6 sessions
Stop loss of daily close below

Hariom Pipes - 200EMA crossoverA stock that's been doing well for itself business wise.
The company is guiding of a 40% CAGR growth over the next 2 years at least.
Long at current price with a stoploss below 550.
Add more above 600..
The 200EMA is a great crossover point.
Additionally Malabar Capital has recently increased its stake in the co to above 5%.

Hariompipe- copy-weekly-10-and-above-gainers-9Hariompipe- copy-weekly-10-and-above-gainers-9
1) Retest below 144
2) Now up 144
3) Super rejection

HARIOMPIPEVolatility Contraction Pattern is popularized by Mark Minervini, who is a two times US Investing Champion. Last year he won the championship with a record-beating 300+% in the year. He primarily uses VCP for his trading setups. It is a twist on the ascending triangle pattern with some variation.
It has the following characteristics:
The Stock must be in stage 2 uptrend.
A period of price consolidation must take place in the base.
Price consolidation occurs after a stock has moved up in the price, the consolidation (or correction) is a constructive chart pattern that allows the stock to digest the bullish price movement.
Price volatility must contract through the base (from left to right).
During this period of price consolidation the stock price will correct.
Price must correct through a series of smaller contractions.
Each contraction should be tighter than the last, representing the absorption of more weak holders. Ideally this pattern has between2-4 contractions

Simple VCP!#HARIOMPIPE
+VCP.
+Volume Breakout.
+Key EMA support.
Added at 662!
SL below horizontal support!

HARIOMPIPE - Breakout after 225+ daysConsolidation days : 225+ days
I Post educational chart for 3 Swing / Potential Stocks Everyday.
Check Related Ideas section for more Swing Stock analysis.

Price ready for trendline breakoutPE - 33
ROE 19
✔️Price near to trendline resistance & above which closing is imp.
✔️Post breakout price may retest the same trendline as support
Maintain SL as per risk management. Follow for more such stocks.

hariompipestock is falling from some day now at important support zone
expected to reverse above trendline resistance

Hariom Pipes - Peak MomentumThe stock has had no looking back..just moving up and up..
Many people are put off by the same but the management is growing the co and guiding to double profits each year over the next 2 years..This could mean the stock still has a lot of upside left..
Long at current prices with stoploss below 615..
Can even double up above 690.
This one could go till the shadow top of this move too..
