HAVELLS longTook support on bottom trendline, and retested the 50 EMA and RSI, possible up move from CMP 1200 to TGT of 1340 with SL of1130
disclaimer: this is not a call, i am not responsible for you losses & profits.
Trade ideas

Havells DTFNot a strong Green Candle. probably would retract and give a strong breakout
After analyzing Havells's stock, there are indications that a potential breakout may occur in the near future
However, it's important to note that stock market investments come with inherent risks, and predicting breakouts or price movements accurately is challenging. It's advisable to consult with a financial advisor or conduct further research to validate the analysis and make informed investment decisions.

havellsENTRY TARGET SL Mention in the chart.
ALWAYS TAKE TRADE WITH CONFIRMATION
Note : Trading in any financial market is very risky. I post ideas for educational purpose only. It is not financial advice. Do not hold us responsible for any potential loss you may incur. Please consult your financial adviser before trading.

#Havells cash : Breakout leve support taken#Havells cash -Positional call
24.05.2023
Looks good above 1280
Stoploss 1240
Target 1316-1320/1360
Cmp 1274

Head & shoulders head & shoulder breakout with support of breakout point in havells and near to major trendline of weekly chart. The company has also given good quarterly result therefore it may blow in upcoming session


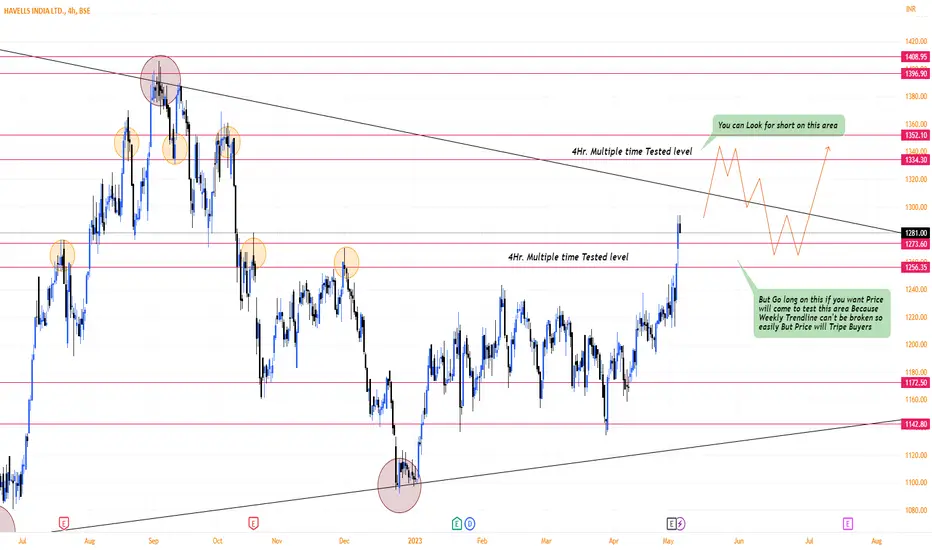
HAVELLS✅ Price recently break 1256-1273 Resistance zone that tested multiple time.
✅ But on Weekly time frame there is a strong trendline coming that also test 2 time in row.
✅ But you can look for short on 1334-1352, But you can look Long on 1256-1273 level when price break weekly trendline and on retest with strong reversal on 1256-1273 area you can go long.
Havells Cmp 1256 Triangle Bo & RSI BoHavells Cmp 1256 dated 4-5-2023
1. Triangle Pattern break out above 1246
2. RSI breakout
Buy above 1261 for target 1285-1310-1340-1390 Sl 1210
It is just a view, please trade at your own risk.


Havells UpsideHavells closing 1241.3 with stop loss 1200 then targets are 1290-1350-1400+.
Buying Reason.
1 --> Price make the Breakout at 200 EMA.
2 --> Price makes the Bullish Engulfing pattern.
3 --> RSI is cross above 60 Level.
4 --> ADX is showing some moves.
5 --> Volume is a breakout and price is given a good breakout.
6 --> Bollinger Bands are open in Daily and Weekly on the upside.

Havells - Breakout tradeLooking good for long.
PS: Do you own research.
Drop your doubts in the comment section

HAVELLS - #intraday Chart Analysis || 26th April,2023 #stocksAnalysis Criteria Used:
1. Please find the Chart Analysis done for the Intraday Stock Trade Idea levels for 26th April, 2023
2. The analysis for the Trade ideas, has been done based on Trend analysis and Chart Patterns with Volume Buildups
Focus On:
1. Always keeping your Risk Management in play
2. Using a Stop Loss; because it is your Best Friend
3. Always Plan your Trade and stick to your Plan
4. Dont overthink or overanalyse
5. Treat this as your Business and get serious about it
#sharemarket #stockmarket #nifty #sensex #investing #trading #nse #bse #stockmarketindia #stocks #indianstockmarket #investment #stockmarketnews #banknifty #finance #money #intraday #intradaytrading #investor #niftyfifty #dalalstreet #sharemarketindia #sharemarketnews #stockmarketinvesting #business #sharemarkettips #stock #india #indiansharemarket #rakeshjhunjhunwala #bhfyp #mumbai #share #wealth #investment #market #invest #trading #investing #finance #FinancialFreedom #investor #trader #stocks #profit #investors #economy #equity #shares #nifty #stockexchange
DISCLAIMER:
.
* Please do your own research and/or contact your financial advisor before taking any trading opportunities
** We will not be responsible for your profit or loss
*** We are NOT SEBI REGISTERED
______________________
best stocks to buy today
best stocks to buy now
best stocks to buy
best stocks for Intraday tomorrow
best stocks for long term investment
best stocks to buy today india
best stocks for swing trading
swing trading strategies
swing trading beginners
what is swing trading
swing trading stocks
swing trading stock selection
swing trading kya hai
nifty analysis
nifty view
bank nifty analysis
top stocks to buy now
strong stocks
nifty view
nifty prediction
stock market view tomorrow
bank nifty Levels
bank nifty prediction
share news
stock market news
best stocks to buy now
profit booking stocks
multibagger stocks in discount
breakout stocks
best short term stocks
best short term shares
next multibagger stocks

long positionallong Positional with Sl 1180 Tgt 1250, 70, 1300 and more in Next Month we can see 1350 1400
Take at your own Risk and your own readings
We can see a Support DTF trendline as well as on WTF and MTF

HAVELLS SHORT on low breakoutHavells can short for atleast 1:2 on low breakout of doji,stock at resistanceas & high volume on doji candle with doji high above as sl

long for this expirylooking for a nice upside for this expiry
target till 1255-65
stop as per comfort
breakout based trade using indicators RSI, fibo, trend line to enter the trade
disclaimer - trade @ own risk

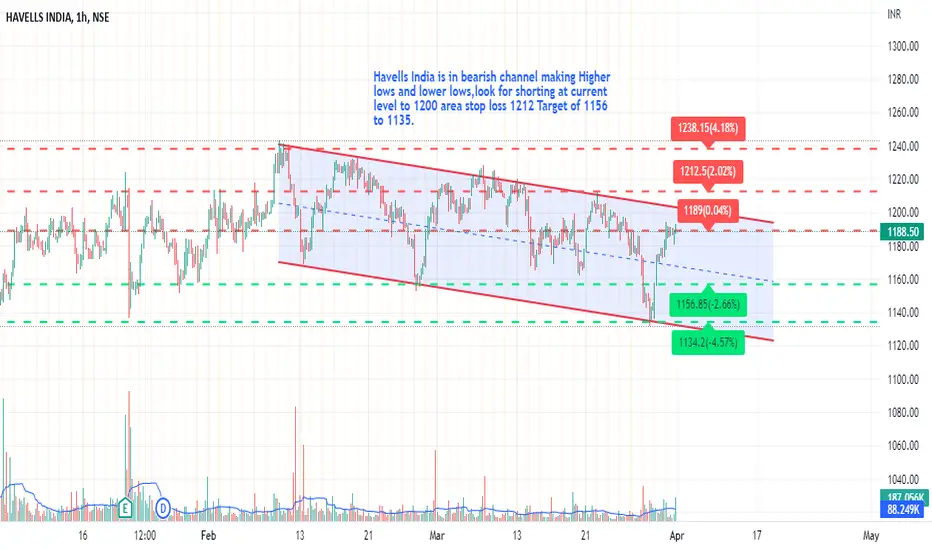
Havells India Short Havells India is in bearish channel making Higher lows and lower lows now at resistance level,look for shorting with price aciton at current level to 1200 area stop loss 1212 Target of 1156 to 1135.
HavellsHavells
At trendline resistance
Keep an eye
Staying above 1225 one can initiate long positions with SL 1190
Target 1267/1340

intradayboth side potential
avoid first 15min breakout
wait for 15 min candle closing
targets are marked
follow risk management
do your own analysis
do workout
do meditation
start reading book

29th March || POST MARKET UPDATE - 3 Targets AchievedAnalysis Criteria Used:
1. The analysis for the Intraday Trade ideas, has been done based on Trend analysis and Chart Patterns with Volume Buildups
Focus On:
1. Always keeping your Risk Management in play
2. Using a Stop Loss; because it is your Best Friend
3. Always Plan your Trade and stick to your Plan
4. Dont overthink or overanalyse
5. Treat this as your Business and get serious about it
#sharemarket #stockmarket #nifty #sensex #investing #trading #nse #bse #stockmarketindia #stocks #indianstockmarket #investment #stockmarketnews #banknifty #finance #money #intraday #intradaytrading #investor #niftyfifty #dalalstreet #sharemarketindia #sharemarketnews #stockmarketinvesting #business #sharemarkettips #stock #india #indiansharemarket #rakeshjhunjhunwala #bhfyp #mumbai #share #wealth #investment #market #invest #trading #investing #finance #FinancialFreedom #investor #trader #stocks #profit #investors #economy #equity #shares #nifty #stockexchange
DISCLAIMER:
.
* Please do your own research and/or contact your financial advisor before taking any trading opportunities
** We will not be responsible for your profit or loss
*** We are NOT SEBI REGISTERED
______________________
best stocks to buy today
best stocks to buy now
best stocks to buy
best stocks for Intraday tomorrow
best stocks for long term investment
best stocks to buy today india
best stocks for swing trading
swing trading strategies
swing trading beginners
what is swing trading
swing trading stocks
swing trading stock selection
swing trading kya hai
nifty analysis
nifty view
bank nifty analysis
top stocks to buy now
strong stocks
nifty view
nifty prediction
stock market view tomorrow
bank nifty Levels
bank nifty prediction
share news
stock market news
best stocks to buy now
profit booking stocks
multibagger stocks in discount
breakout stocks
best short term stocks
best short term shares
next multibagger stocks

29th March || HAVELLS - Intraday Targets Marked #stocks #targetsFocus On:
1. Always keeping your Risk Management in play
2. Using a Stop Loss; because it is your Best Friend
3. Always Plan your Trade and stick to your Plan
4. Dont overthink or overanalyse
5. Treat this as your Business and get serious about it
#sharemarket #stockmarket #nifty #sensex #investing #trading #nse #bse #stockmarketindia #stocks #indianstockmarket #investment #stockmarketnews #banknifty #finance #money #intraday #intradaytrading #investor #niftyfifty #dalalstreet #sharemarketindia #sharemarketnews #stockmarketinvesting #business #sharemarkettips #stock #india #indiansharemarket #rakeshjhunjhunwala #bhfyp #mumbai #share #wealth #investment #market #invest #trading #investing #finance #FinancialFreedom #investor #trader #stocks #profit #investors #economy #equity #shares #nifty #stockexchange
DISCLAIMER:
.
* Please do your own research and/or contact your financial advisor before taking any trading opportunities
** We will not be responsible for your profit or loss
*** We are NOT SEBI REGISTERED
______________________
best stocks to buy today
best stocks to buy now
best stocks to buy
best stocks for Intraday tomorrow
best stocks for long term investment
best stocks to buy today india
best stocks for swing trading
swing trading strategies
swing trading beginners
what is swing trading
swing trading stocks
swing trading stock selection
swing trading kya hai
nifty analysis
nifty view
bank nifty analysis
top stocks to buy now
strong stocks
nifty view
nifty prediction
stock market view tomorrow
bank nifty Levels
bank nifty prediction
share news
stock market news
best stocks to buy now
profit booking stocks
multibagger stocks in discount
breakout stocks
best short term stocks
best short term shares
next multibagger stocks

Havells ready for a short and then a swing long watch the fib levels as well as the zones marked.
do not trade blindly.
use this along in combination with your setup.

Havells Long for 1270 in short term#HAVELLS has been moving inside the range shown as rectangle. Short term target here is 1270. Lets see how it goes.

Havells Cmp 1181 dated 24-2-2023 Triangle & RSI breakdownHavells Cmp 1181 dated 24-2-2023
1. Triangle Pattern break down below 1198
2. RSI breakdown
Sell @ Cmp for target 1170-1160-1150-1140 SL 1200
Disclaimer :
I am not a SEBI registered Analyst so please do your own Analysis before taking any action.
The above view is shared just for educational purpose.
By no means shall be responsible for any losses amounting out of it incase if any trades on it.
It is just a view, please trade at your own risk.
