HCL Technologies Ltd.Bearish Continuation Heikin Ashi Pattern formed.
RSI Shows negative mark.
Daily Time Frame arami formed with very weak volume. Possibly a bad signal
HCLTECH trade ideas

Monthly support HCl retest PR ious monthly resistance that become support now.buy and target will be 1750 with stop loss of 1250.


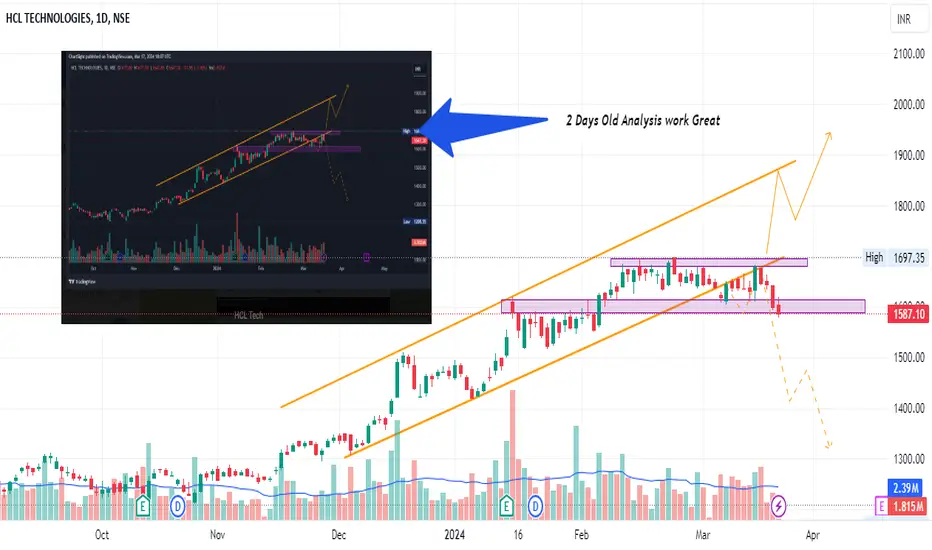
HCL TechAll detail for chat. good entry at mark price only. and must stoploss minimum risk and good profit. risk ratio 1:1 in first target. This is not call, Just my idea. Please understand your risk and take full responsibility of your actions
SL 1Hr candle close only, Target Trigger Price

HCL TECH - SWING TRADE ON LONG SIDESymbol - HCLTECH
HCL Tech is currently trading at 1360
1300 - 1360 is a good support area for HCL Technologies Ltd.
I'm seeing a trading opportunity on buy side.
Buying HCL Tech Futures at CMP 1360
I will be adding more if 1330 comes & hold with SL of 1295
Targets I'm expecting are 1440 - 1485 & beyond.
Disclaimer - Do not consider this as a buy/sell recommendation. I'm sharing my analysis & my trading position. You can track it for educational purposes. Thanks!

HCLTECH head & shoulder pattern possible breakoutGood rounding bottom inverted H&S pattern in HCLTECH weekly timeframe. Above 1360 it will start giving good rally. Focus on this for next couple of months this can give good returns. News can trigger this move. And positive news already there today.
Keep this in mind. Options is a dangerous instrument to play. Please do not go wild on anything unless you know exactly what you doing. Even though your direction is right still you tend to loose in option buying. And market can always prove me wrong and i take that rights too. Experience traders also fail in this market. Only risk management will give you an edge. Don’t take any trades without SL. Respect the market, Ungli nahi katoge to pura hath katna padega. Beware.
DISCLAIMER: I AM NOT SEBI REGISTERED ANALYST. ALL POSTS ARE EDUCATIONAL PURPOSES.NON ADVISORY, DISCRETIONAL NO CLAIMS, RIGHTS RESERVED. I AM NOT RESPONSIBLE FOR YOUR PROFIT OR LOSS.

HCLTECH Near Support Hold or Break NSE:HCLTECH This Guys Fall 24% in 77 - Days Now Near Support and FIB 50% also We Need Wait For Reversal and Candle Closing ---- Add to Your Watchlist

Stock correction doneThe stock is ready to rally after a long correction stock can rise from here . Fundamentally stock is good

HCL Correction looks overNSE:HCLTECH
Weekly and Daily TF analysis
Wave 4 correction looks getting over
Wave 5 Rally shall resume

HCL tech three outside down candle1. weekly chart showing three outside down candles so it may go downside in upcoming days
2. if the falls continue it may fall up to 1423
I shared this idea for learning purpose only. Tread with your own risk
I'm not Sebi registered adviser.

support at all time high zone, Looks good for next 1-3 yearsBreakout and RETRACEMENT at all time high zone
From 2021-2024
Sales from 75 to 109
Profit from 11.1 to 15.7

HCL 1:6 RR trade set up1. Set up: Reversal with FIB levels
2. Trend Bullish
3. RR: 1:6 RR
4. SL follow on closing basis

Hcltech buy at 1550 Target 1620, 1670On Our Harmonic pattern indicator based trade setup take trade as explained below :-
Early trades Buy or sell below/ above 23.6 %, safe trades buy or sell above / below 41% , after taking trade next upside or downside levels will be target ,
When reverse buy or sell signal appear then book profit on Target or trail SL to 23.6 % If trailing SL hit then early trade can be taken above or below 23.6 and safe trade can b taken above/ below 41% ..
Please note:-
It's working on news based and volitile market very well so exit if SL hit

HCL Tech at Do or Die LevelThere is a one more stock Which is showing a great opportunity, stock is near Support it's do or die. what is your view please comment it down. We are NISM Certified. All views shared on this channel are my personal opinion and is shared for educational purpose and should not be considered advise of any nature.
Pasted a image from my private idea because daily idea post limit is reached.
HCL bullishHCl looking bullish as per inverted head and shoulder current market trading # 1262 on 10 sep 2023

HCLTECH - 1 Year targetsThis post is for educational purpose only, please take any trade at your own risk.
C&H pattern targets already achieved, now flag pattern on monthly need to be achieved, for now 1680 seems near term target, 1880 medium term target and 2080 long term target (6 months to 1 Yr most likely)

This IT stock has more upsideFib- this counter is in a strong bull trend. Right now it is stuck at first resistance at 1628. Its a fresh buy above 1628 with T1 1690 and T2 1800. Both are fib confluence zones and the stock will face resistance at these zones.
MA- on the 7min chart all the three MA's are together and hence an indication that the counter is ready for a sharp move.

HCLTECH Trade plan for coming weeks1. ATH Breakout - Confirmed
2. Potential Target 1921+
3. Trend Bullish
4. Market Trend - Bullish

HCLTECH can fall till 1455 and 1350On Our Harmonic pattern indicator based trade setup take trade as explained below :-
Early trades Buy or sell below/ above 23.6 %, safe trades buy or sell above / below 41% , after taking trade next upside or downside levels will be target ,
When reverse buy or sell signal appear then book profit on Target or trail SL to 23.6 % If trailing SL hit then early trade can be taken above or below 23.6 and safe trade can b taken above/ below 41% ..
Please note:-
It's working on news based and volitile market very well so exit if SL hit

HCLTech, Strong Breakout n Fundamentally StrongEducation Purpose only..
Strong Breakout with strong Candle..
Fundamentally Strong..

HCLTech (Weekly Breakout Stock)HCLTech can give a breakout above the 1377 level. The stock needs to close above the 1377 level. The chart looks good on weekly and monthly time frames. It has a possible upside of 1483 and 1650. One can place a stop loss of 1357 on a weekly closing basis. The level of 1377 can act as a support zone. Also, a round bottom pattern can be seen on a weekly time frame.
Disclaimer: I am not a SEBI registered analyst. All the stocks are for educational purposes. Investors must consult a financial advisor before making any investment. It is not a buy or sell recommendation

HCLTECH BO [Weekly]IT Index all the way, all stocks are showing strength, some have broken out of huge bases in weekly timeframe, some are about to.
HCLTECH a big player, showing these kinds of volumes and price movement is just wow...
Looks like something big is brewing in IT ahead..

HCLTECH WEEKLY CHART 12/01/2024 RESULTS DAYHCLTECH has taken support at 50% level at 876.50. Gann 50% rule at work. Gann said you need to follow only one rule of 50% to make money in the markets.
We are at 12.5% extension of the swing which is 1503.05.
We need to stay above this level for furthet growth.
Happy Trading !!!
