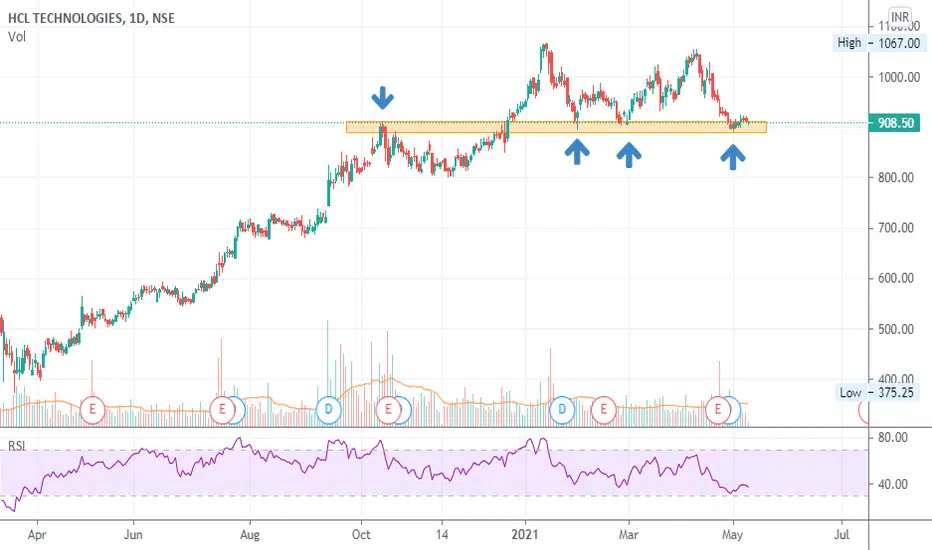
HCL tech RSI divergence spotted. Buy when stock falls, or short sell now. Would be safer to buy when price falls, rather than shorting now.
Head and shoulder pattern will complete when price falls below 820. Would be a great buying opportunity for 30% upside!
buy near 800 - 820 level from where stock should rebound 30%
Trade ideas

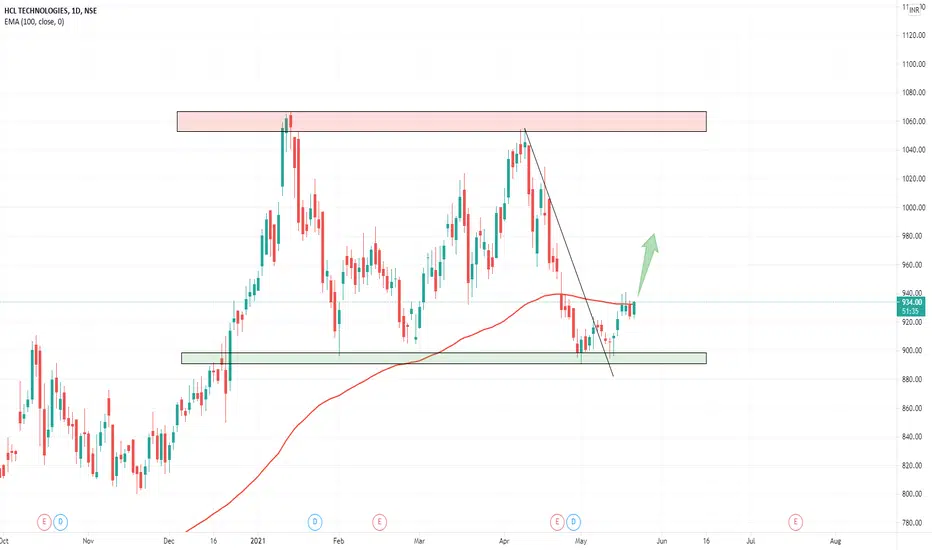
HCLTECH - Bouncing back from the Key support levelFrom past few months, HCLTECH is trending in a channel range between 895 and 1035. Post Q1 Earnings, tested lower range twice and bounced back from those levels. It shows good buying interest at those levels. I expect stock to move towards 1000 in this recent pull back.
Disclaimer : above views are only for educational purposes.

HCL Tech Cmp 931 dated 21.5.2021HCL Tech Cmp 931 dated 21.5.2021
1. Triple Bottom on weekly chart, where chart
taking support.
Buy for a tgt of 970-1000 -1040 SL 885
It is just view, pls trade at your own risk.


HCL Tech reversal from SupportAt 1hr chart pattern HCLTECH has taken a good support approx 900 level. This level was previously tested by the stock multiple times. Again it is moving in upward direction. Closed today above 50 EMA and journey of 200 EMA can be seen in short term period. Lets See…

5th wave due in hcltech for selling below trendline breakhcl tech is about to complete its 4th correction wave. and now 5 th wave will resume for tgt of 850 or below.


Hcl technologies time for perfect entry - DON’T MISS IT Now HCL formed cyclic double bottom and completed W pattern. Also completed retesting zone.. time to perfect entry with stoploss....


Stock Analysis of HCL TechPrice - 931.40 Dt. - 19.05.2021
The stock seems bullish after falling on the average result. The stock closed right above the 21 DEMA and near the support line. It looks like the 21 DEMA can cross 50DEMA from below in few days.
HCL Tech can go up to the resistance line placed at 1010 giving a nice 8% return on investment.

HCL Tech Long Stock forming a Double Bottom and a rounded bottom and reversing from demand zone. Upside to 1050 levels.


HCL Tech - LongStock has formed a double bottom formation and has reversed. Looks good for going long. Sector has also been underperforming for some time now

START OF NEW NEO IMPULSE WAVE.GET LONGPRICE BREAKOUT IN TODAYS TRADING SESSION @ 916
ALSO PRICE HAS MULTIPLE SUPPORT AROUND 900-905 AREA
TODAY'S MOVE SUGGESTING END OF AN CORRECTION AND START OF NEW IMPULSE.
BREAKOUT IS ALSO ACCOMPANIED BY MACD REVERSAL
EXTREMELY FAVORABLE RISK-REWARD RATIO FROM CURRENT PRICE.
LONG @ CMP OF 931 AND ADD IF PRICE COMES @ 916
STOP LOSS OF 904 ON CLOSING BASIS
TARGET 1050.
TIME FRAME-1 MONTH.
DISCLAIMER:There is no guarantee of profits or no exceptions from losses. The study provided is solely the personal views of my research. You are advised to rely on your judgment while investing/Trading decisions. Past performance is not an indicator of future returns. Investment is subject to market risks. Seek help of your financial advisors before investing/trading.
I may or may not trade this analysis

HCLTECH 10 % PROFIT EXPECTINGHCLTECH took support and it is now going up. Expect a profit near 10 percent.

SWING HCLHope this trade will give me some profit...
If you also taken the same trade, please hit the like button...

Rounding bottom Breakout in HCL techStock has made rounding bottom right at support levels after big correction. Targets Rs 1040, SL Rs 890 , Time frame- 1-2 months.

HCLTECH LONGA decisive break below 912, price might further move up to 928/938
SL : 901
Disclaimer:
The content of the idea and the interpretation of data are solely my personal views which being said I do not warrant its completeness or accuracy.
This idea published is purely intended for educational and informative purposes, I urge traders to make their own trading decisions based on their specific trading objectives and financial position