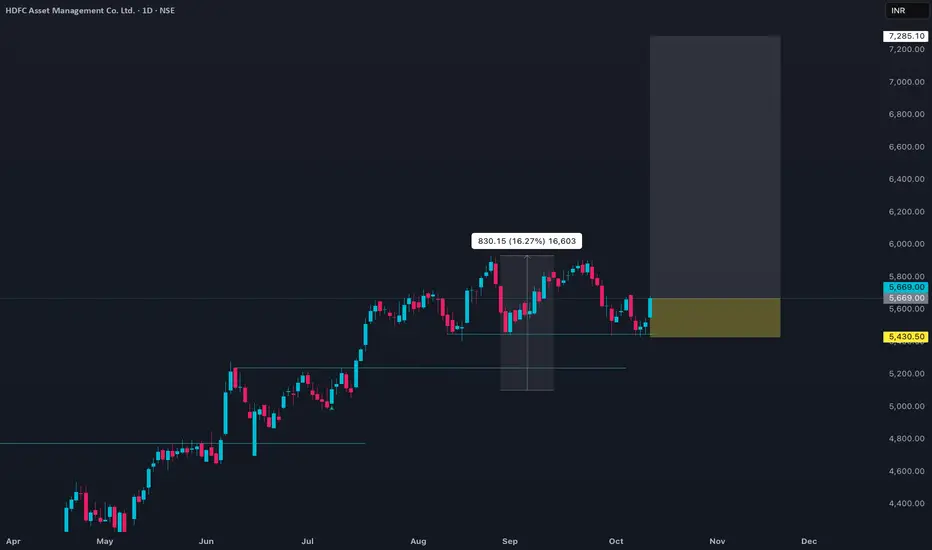
HDFCAMC Channel Structure – Watching price acceptance key levelHDFCAMC has been moving inside a well-defined descending channel, respecting both the upper resistance and lower support trendlines.
Recently, price attempted to reclaim an important horizontal level inside the channel. Instead of an impulsive move, the stock is now pausing and stabilizing above th
HDFC Asset Management Co. Ltd.
No trades
Next report date
—
Report period
—
EPS estimate
—
Revenue estimate
—
67.15 INR
24.60 B INR
40.60 B INR
202.12 M
About HDFC Asset Management Co. Ltd.
Sector
Industry
CEO
Navneet Munot
Website
Headquarters
Mumbai
Founded
1999
IPO date
Aug 6, 2018
Identifiers
2
ISIN INE127D01025
HDFC Asset Management Co. Ltd. engages in the provision of asset management services. It also offers portfolio management and advisory services to clients. The company was founded on December 10, 1999 and is headquartered in Mumbai, India.
Related stocks

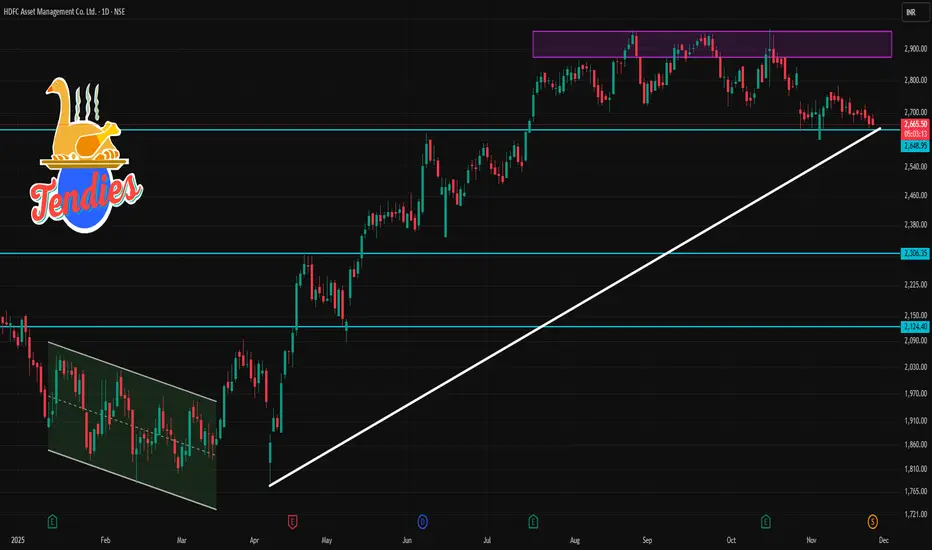
HDFCAMC - Demand Reclaim, Institutional Participation Visible💹 HDFC Asset Management Co. Ltd (NSE: HDFCAMC)
Sector: Financial Services – Asset Management | CMP: 2723
View: Bullish — Demand Reclaim, Institutional Participation Visible
HDFCAMC has staged a sharp recovery from its lower demand zone, supported by a strong bullish candle and clear volume expansi

HDFCAMC 1 Day Time Frame 📊 Current Price & Context
1. Recent quoted price on several platforms is ~ ₹ 2,667 / ₹ 2,670 (on an adjusted basis, after its 1:1 bonus share issue) for HDFCAMC.
2. Historically (pre-bonus) the “old” nominal price was ~ ₹ 5,336–₹ 5,340.
3. The share is currently trading with valuation metrics: hig
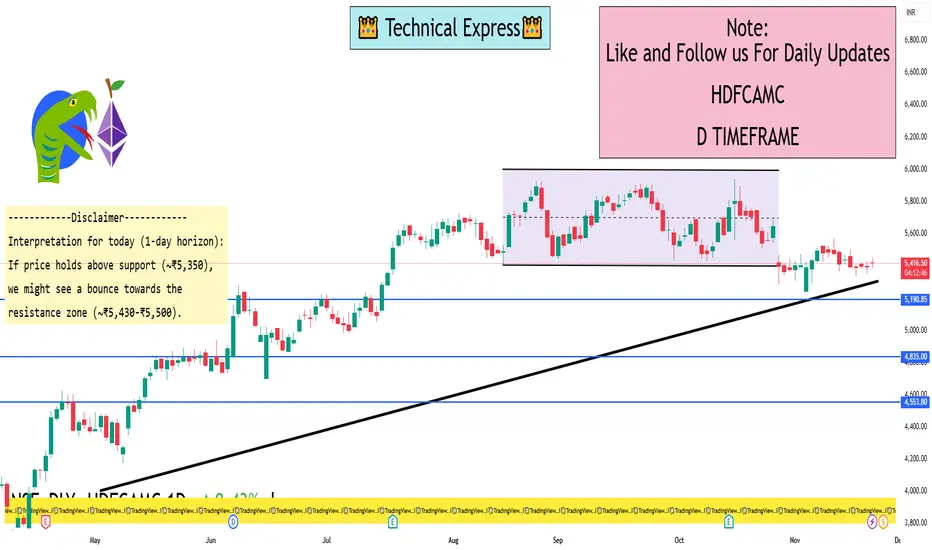
HDFCAMC 1 Day View Current price (approx): ₹5,444.50 as of 10:48 AM IST on 24 Nov 2025.
Day’s range: Low ~ ₹5,385.00, High ~ ₹5,447.00.
Recent support zone: ~ ₹5,354-₹5,316 (based on 5Paisa pivot levels)
Immediate resistance zone: ~ ₹5,428.83-₹5,502.83 (from same pivot table)
Interpretation for today (1-day ho
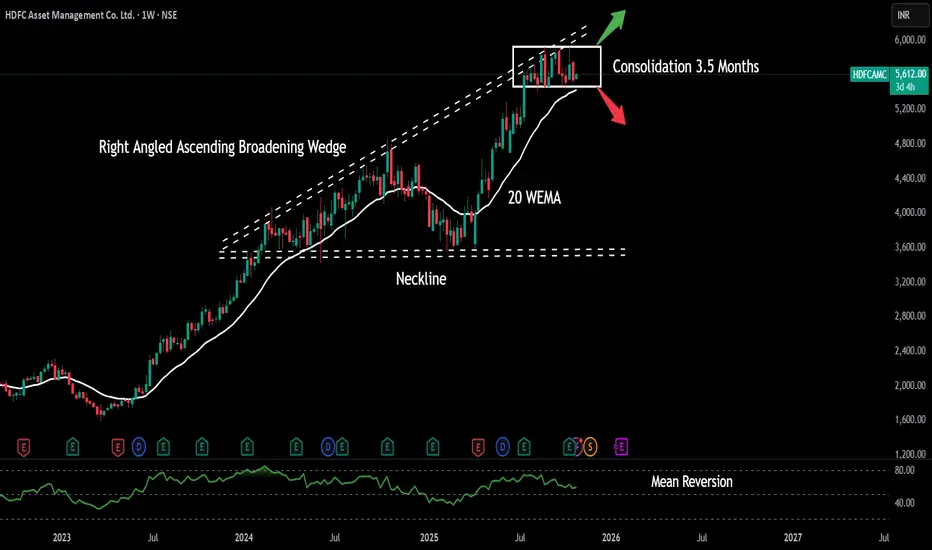
HDFC Asset Management Company Date 28.10.2025
HDFC AMC
Timeframe : Weekly Chart
About
(1) The company acts as an Investment Manager for HDFC Mutual Fund, one of the largest mutual funds in India.
(2) It offers 98 mutual fund schemes, including 39 equity-oriented, 32 debt-oriented, 2 liquid, and 25 others
Market Share
(1)
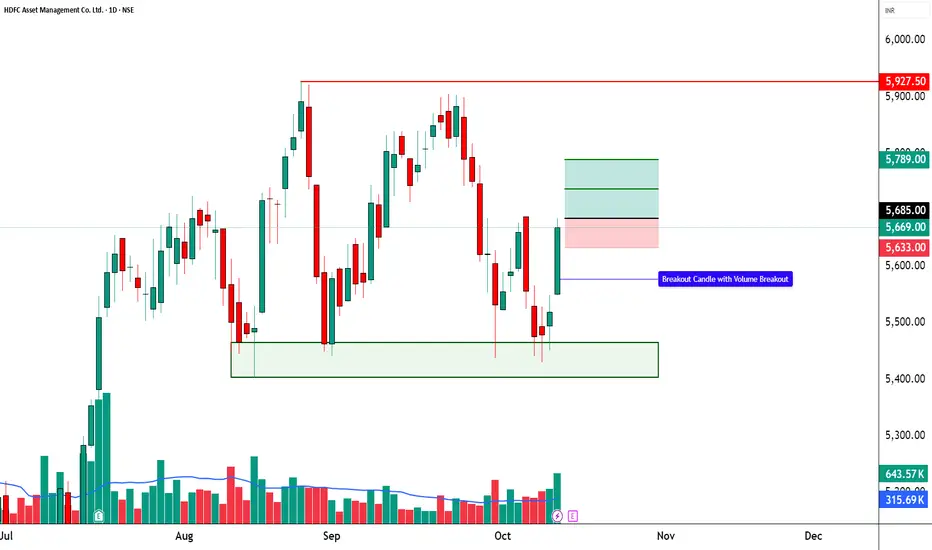
HDFC AMC LTD | Bullish Momentum + Possible Breakout📈 HDFC AMC LTD | Bullish Momentum + Possible Breakout 🚀
🔹 Bullish Breakout Zone: 5,660 – 5,685
🔹 Stop Loss: 5,633 (Risk ~₹52)
🔹 Supports: 5,584 / 5,499 / 5,448
🔹 Resistances: 5,719 / 5,770 / 5,855
🔑 Key Highlights
HDFC AMC has formed a strong bullish candle with a notable volume surge, clearly conf
HDFCAMC - Bearish Shark in play 5830-5930 is the PRZ
TF: 75 minutes
CMP: 5740
The structure is exhibiting a Bearish SHARK Harmonic pattern.
The PRZ is placed at 5850.. however, the zone is 5830-5930
One can wait for the price to reach the PRZ, monitor the price action before jumping in.
As per the pattern, the price is expected to retrace to a mi

HDFCAMC Pyramid Price ActionHDFC Asset Management Company Ltd (HDFCAMC) is currently trading around ₹5,669. The stock has recently advanced nearly 2.7% in a single day, with session lows near ₹5,550 and highs close to ₹5,684. Its 52-week range sits between ₹3,525 and ₹5,926, putting the current price near the upper end of its
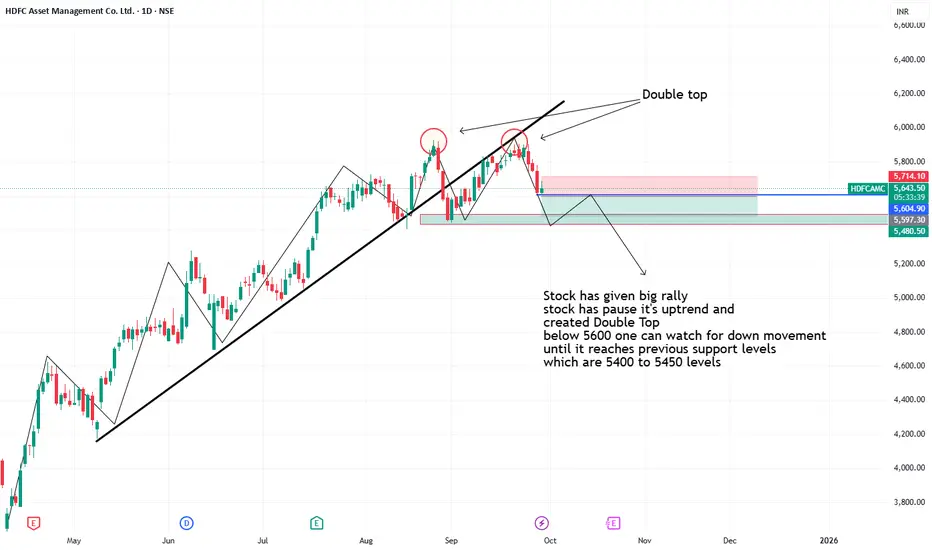
Hdfc created Double Top Formation- Stock has given big rally
- stock has pause it's uptrend and
created Double Top
- below 5600 one can watch for down movement
until it reaches previous support levels
which are 5400 to 5450 levels
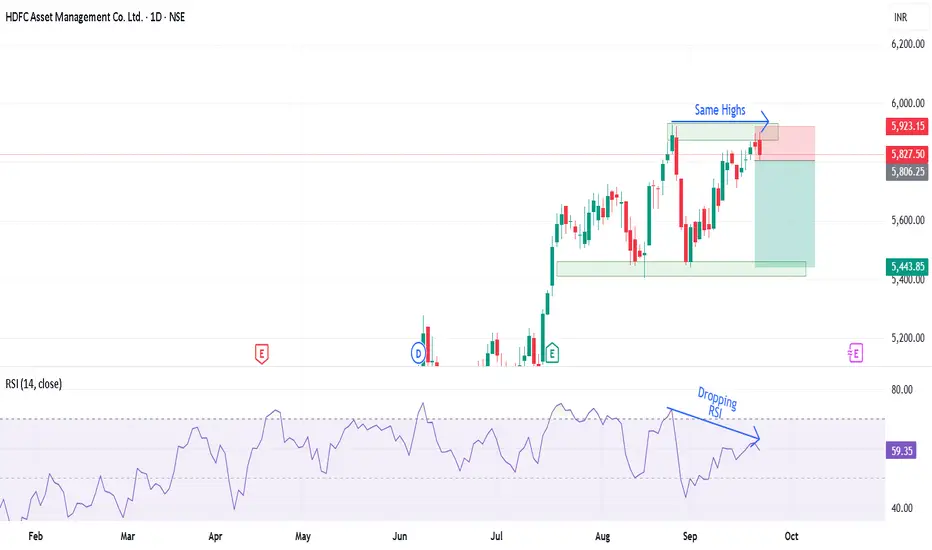
Double Top at the Peak: Is a Bearish Reversal Coming in HDFC AMCHDFC AMC has given a good upside rally of 65% and is form a double top pattern.
The stock is following a bullish trendline but the RSI divergence is creating a bearish sentiment supported by the drop India VIX.
If the stock breaks below the trendline, a bearish trade can be entered with the first
See all ideas
Summarizing what the indicators are suggesting.
Neutral
SellBuy
Strong sellStrong buy
Strong sellSellNeutralBuyStrong buy
Neutral
SellBuy
Strong sellStrong buy
Strong sellSellNeutralBuyStrong buy
Neutral
SellBuy
Strong sellStrong buy
Strong sellSellNeutralBuyStrong buy
An aggregate view of professional's ratings.
Neutral
SellBuy
Strong sellStrong buy
Strong sellSellNeutralBuyStrong buy
Neutral
SellBuy
Strong sellStrong buy
Strong sellSellNeutralBuyStrong buy
Neutral
SellBuy
Strong sellStrong buy
Strong sellSellNeutralBuyStrong buy
Displays a symbol's price movements over previous years to identify recurring trends.
Frequently Asked Questions
The current price of HDFCAMC is 2,842.20 INR — it has decreased by −0.79% in the past 24 hours. Watch HDFC Asset Management Co. Ltd. stock price performance more closely on the chart.
Depending on the exchange, the stock ticker may vary. For instance, on NSE exchange HDFC Asset Management Co. Ltd. stocks are traded under the ticker HDFCAMC.
HDFCAMC stock has risen by 1.46% compared to the previous week, the month change is a 12.60% rise, over the last year HDFC Asset Management Co. Ltd. has showed a 50.98% increase.
We've gathered analysts' opinions on HDFC Asset Management Co. Ltd. future price: according to them, HDFCAMC price has a max estimate of 3,620.00 INR and a min estimate of 2,580.00 INR. Watch HDFCAMC chart and read a more detailed HDFC Asset Management Co. Ltd. stock forecast: see what analysts think of HDFC Asset Management Co. Ltd. and suggest that you do with its stocks.
HDFCAMC reached its all-time high on Oct 16, 2025 with the price of 2,967.25 INR, and its all-time low was 625.00 INR and was reached on Sep 21, 2018. View more price dynamics on HDFCAMC chart.
See other stocks reaching their highest and lowest prices.
See other stocks reaching their highest and lowest prices.
HDFCAMC stock is 2.05% volatile and has beta coefficient of 1.56. Track HDFC Asset Management Co. Ltd. stock price on the chart and check out the list of the most volatile stocks — is HDFC Asset Management Co. Ltd. there?
Today HDFC Asset Management Co. Ltd. has the market capitalization of 1.21 T, it has increased by 2.95% over the last week.
Yes, you can track HDFC Asset Management Co. Ltd. financials in yearly and quarterly reports right on TradingView.
HDFC Asset Management Co. Ltd. is going to release the next earnings report on Apr 28, 2026. Keep track of upcoming events with our Earnings Calendar.
HDFCAMC earnings for the last quarter are 18.00 INR per share, whereas the estimation was 22.52 INR resulting in a −20.08% surprise. The estimated earnings for the next quarter are 18.62 INR per share. See more details about HDFC Asset Management Co. Ltd. earnings.
HDFC Asset Management Co. Ltd. revenue for the last quarter amounts to 10.75 B INR, despite the estimated figure of 10.76 B INR. In the next quarter, revenue is expected to reach 10.98 B INR.
HDFCAMC net income for the last quarter is 7.69 B INR, while the quarter before that showed 7.18 B INR of net income which accounts for 7.10% change. Track more HDFC Asset Management Co. Ltd. financial stats to get the full picture.
Yes, HDFCAMC dividends are paid annually. The last dividend per share was 90.00 INR. As of today, Dividend Yield (TTM)% is 1.60%. Tracking HDFC Asset Management Co. Ltd. dividends might help you take more informed decisions.
HDFC Asset Management Co. Ltd. dividend yield was 2.24% in 2024, and payout ratio reached 78.15%. The year before the numbers were 1.87% and 76.92% correspondingly. See high-dividend stocks and find more opportunities for your portfolio.
As of Feb 17, 2026, the company has 2.21 K employees. See our rating of the largest employees — is HDFC Asset Management Co. Ltd. on this list?
EBITDA measures a company's operating performance, its growth signifies an improvement in the efficiency of a company. HDFC Asset Management Co. Ltd. EBITDA is 37.81 B INR, and current EBITDA margin is 83.45%. See more stats in HDFC Asset Management Co. Ltd. financial statements.
Like other stocks, HDFCAMC shares are traded on stock exchanges, e.g. Nasdaq, Nyse, Euronext, and the easiest way to buy them is through an online stock broker. To do this, you need to open an account and follow a broker's procedures, then start trading. You can trade HDFC Asset Management Co. Ltd. stock right from TradingView charts — choose your broker and connect to your account.
Investing in stocks requires a comprehensive research: you should carefully study all the available data, e.g. company's financials, related news, and its technical analysis. So HDFC Asset Management Co. Ltd. technincal analysis shows the buy rating today, and its 1 week rating is buy. Since market conditions are prone to changes, it's worth looking a bit further into the future — according to the 1 month rating HDFC Asset Management Co. Ltd. stock shows the strong buy signal. See more of HDFC Asset Management Co. Ltd. technicals for a more comprehensive analysis.
If you're still not sure, try looking for inspiration in our curated watchlists.
If you're still not sure, try looking for inspiration in our curated watchlists.