Good time for accumulationNSE:HDFCLIFE
Guys start buying hdfc life but be very careful and take positions little by little. Like if I have to invest 100 rupees in the stock I would take a position of 10 rupees(if brave enough take a position of 25 rupees) now and increase it strategically. The stock currently trades at a P/E of 90+ so we may have further corrections but a great time to accumulate this gem. We can later average upwards if needed.
HDFCLIFE trade ideas

My View on HDFC Life for coming weeks/monthsThis is proof that when the bear strikes, fundamentals of the stock become irrelevant. Although please don't mistake me for a bear, I'm just a greedy bull looking for cheaper prices.
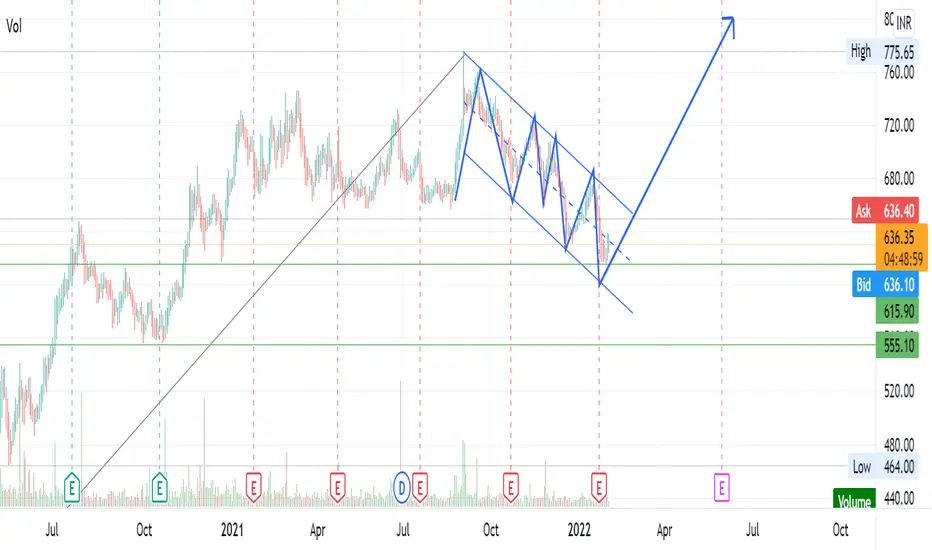
Shown in the chart is a classic example of how early institutional investors dump on retail investors. As you can see in the chart, the entire year of 2021 was a distribution range, and once we broke-down from it, there was an accelerated sell-off. Key notes from the chart :
1) Trend shift has been confirmed as market structure has officially changed to lower highs and lower lows on the weekly/monthly timeframe.
2) This doesn't mean we go short now, because we're at strong support and momentum indicators are extremely oversold.
3) Looking for potential lower highs to get into short positions for lower lows (potential positional trade).
4) We could also potentially trend up from here, re-test current lows, and after some accumulation ultimate trend higher.
Possible paths have been shown (just ideas, doesn't have to play out like this).
Regardless, currently the trend is down, and unless that changes, I will be looking for lower prices. Anything below 500 is a steal from an investment perspective because the stock's fundamentals haven't changed.
Good Luck.
Note: This is not Financial Advice. This is for educational/entertainment purposes only.

#HDFCLIFE bounced off 550 , abv 610 can retest 640#HDFCLIFE in Feb 2022 retested Aug 2020 low price of 553 & bounced bk to 590 levels
If it manages to cl abv 610 on daily charts levels can open up 640 levels on reverse candle shunting

Positional or Longterm Opportunity in Hdfc LifeGo Long above 597.6 for Targets of 643.6, 689.6, and 735.6 with SL 551.6
Reasons to go Long :
1. On a Weekly timeframe if we draw the Fibonacci retracement tool from recent swing low (point A) to recent swing high (point B) then we see stock took support from 0.5 Fibonacci level.
2. Also a bullish candlestick pattern Bullish Hammer (marked with orange color) is formed around 0.5 Fibonacci level.
3. Also there is a strong demand zone (marked with purple color), from which the stock initially faced resistance but now is taking support and moving up.

#HDFCLIFEINSURANCE
NSE:HDFCLIFE
📌 To Trade on This Chart, You Should Have Reversal Trading Knowledge. As Harmonic is One Of The Best Reversal Trading Strategy, But Always Remember That Harmonic Patterns Also Can Fail (there is no holly grail In Stock Market). That's Why One Should Must Have Knowledge Of Reversal Trading To Trade On Harmonic Patterns .
📌 That Dash Line Is Called PRZ, From That Dash Line To that Horizontal Simple Line Area Is Whole PRZ(Price Reversal Zone).
******whatever charts or levels sharing here or on any other platforms are just for educational purpose only, Not A Recommendation To Buy Or Sell. Please do your own analysis before taking any trade on them. We are not SEBI registered.

HDFC life - longIn the past all M&A transactions have taken place at a price to embedded value of 3-3.5
embedded value post acquiring exide life insurance is around 32000.
when the market cap dips below 112000 cr start accumulating the company.
embedded value is the present value of all the future estimated profits on the policies currently written while accounting for the future policy payouts it is calculated by actuarians following the rules set up by IRDAI

HDFC lifeHDFC life :
Reasons/Traits :
* Bullish Bat formation can be seen
* It can also be called as Bear Pattern 1-2-3 (Entry stop loss marked); 1:2/3/4 can used as risk reward if it follows
* Price took support @ 0.786 fib retracements levels
* Price also took support @ 200 EMA while 20 EMA cuts 50 EMA from top
* Falling RSI, Stoch and MACD
What can happen next :
Scenario 1 : Price sustaining above 694 level can take it to 700/710/720/740/760/775 levels
Scenario 2 : Price break down below 682 levels can take it 670/656/644 levels
Disclaimer : This analysis is only for educational purpose and not be considered as any trading idea/tip. Please consult your financial advisor before you take any trade and we are no way responsible for your profits/losses. Thank you!
Please do like and share this idea. Thanks


Hdfc life breakdown #Elliot_HarishRaoIt look like Hdfc life chart break down consoldition area sell this stock and stoploss maintain


BULLISH VIEW FOR SHORT TERMNSE:HDFCAMC
Important levell !!!!!!!!!!!!!!!!!!!!!!!!!!!!!!!!!!!!!!!!!!!!!!!!

HDFCLIFE BULLISH FLAG pattern formed.HDFCLIFE BULLISH FLAG pattern formed.
cmp 636
TGT 645,675 in coming days
SL 623
Disclaimer:
only for educational purpose.
consult your advisor before investment
Hdfc life 15 min chart Taking support at horizontal line : if 615 holds we might get decent rally upto 632//643

Buy above 632 TGT 642 Sell below 619 TGT 610Suggestions are based on my analysis only. Please do your analysis before taking any trade.


HDFC LIFE Ready For buy with good R/R HDFC LIFE IS A Major support and making Reversal
Good time for buy above 650
BUY ABOVE 650 WITH AN R/R OF 1/3
THIS IS A SWING TRADE

HDFCLIFE BUYHDFCLIFE BUY for day trading if stock break the resistence then we will enter in trade.....

HDFCLIFE - Break or Fail???INTRADAY - SWING - EDUCATIONAL PURPOSE
entry - 1H candle close above 675.5*
sl - 1.5% from entry
tp - 5% from entry
R:R - 1 : 3.33

HDFCLIFE SELLHDFCLIFE SELL for day trading if stock break the support level then we will enter in stock............

HDFC life insu UPSIDE Pot - Jan-Feb-MarExpected trend for HDFC Life Insurance. 10% upside potential in 20 days.

HDFC Life Daily chartPrice looking set to come breaking out of this long consolidation bearish channel, range of the upbars expanding.

HDFC Life Hourly chartHDFC Life clearly seeing some buying, vcp type structure is visible here in the hourly chart, also the stock has not moved in a year and less eyes on the scrip, can run like SBI life from here. Seems insurance sector run is starting to take baby steps.
Dailly chart also looking lie a good reversal setup overall.
