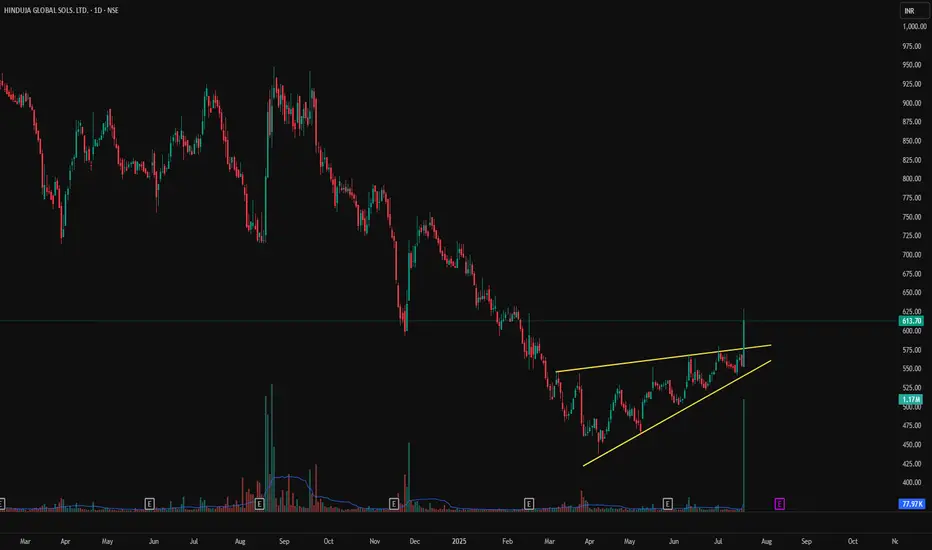
HGS - Rising Wedge Breakout on Volume Spike | Daily Chart📊 HGS – Rising Wedge Breakout on Volume Spike | RSI Above 70 | Fresh Bullish Momentum
📅 Chart Date: July 17, 2025
📍 CMP: ₹613.70 (+10.72%)
📈 Symbol: NSE:HGS | 1D Timeframe
🔍 Technical Analysis Breakdown
🔺 Rising Wedge Breakout
Price broke above the upper resistance of a rising wedge pattern.
Strong
Hinduja Global Solutions Limited
No trades
9.50 INR
1.21 B INR
44.00 B INR
10.80 M
About Hinduja Global Solutions Limited
Sector
CEO
Venkatesh Korla
Website
Headquarters
Bangalore
Founded
1995
IPO date
Jan 13, 1995
Identifiers
2
ISIN INE170I01016
Hinduja Global Solutions Ltd. engages in the provision of outsourcing solutions. It operates through the Business Process Management segment. The Business Process Management segment offers voice and non-voice based services such as contact center solutions and back office transaction processing. The firm's Media & Entertainment activities include the commercial exploitation of Dark Fibre owned by the Company as a licensee under the Telecom regulations. The company was founded on January 13, 1995 and is headquartered in Bangalore, India.
Related stocks
BUY TODAY SELL TOMORROW for 5%DON’T HAVE TIME TO MANAGE YOUR TRADES?
- Take BTST trades at 3:25 pm every day
- Try to exit by taking 4-7% profit of each trade
- SL can also be maintained as closing below the low of the breakout candle
Now, why do I prefer BTST over swing trades? The primary reason is that I have observed that

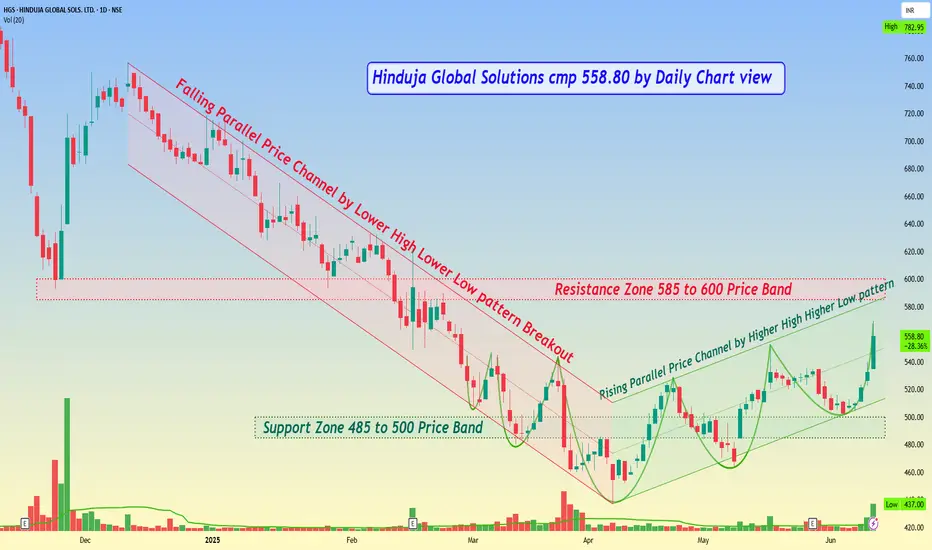
Hinduja Global Solutions cmp 558.80 by Daily Chart viewHinduja Global Solutions cmp 558.80 by Daily Chart view
- Support Zone 485 to 500 Price Band
- Resistance Zone 585 to 600 Price Band
- Rising Parallel Price Channel by Higher High Higher Low pattern
- Falling Parallel Price Channel by Lower High Lower Low pattern Breakout
- Multiple Bullish Roundin
End of correction in Hinduja Global SolutionsElliott wave analysis:-
A long bear trend has been almost over and we may expect a slight fall from here or the Candle may rise to stars from here. if you wish to be cautious then wait for a pullback for almost 65% to 78%. keep the previous low as your stop loss go for a long ride.
i am not a SE

HINDUJA GOLBAL SOLS
**TYPE - BUYING (CE) INVEST **
- ** IFB AGRO #HGS **
**WINE MAKING COMPANY** (TIME-30SEPTEMBER, ARCHIVE TARGET, RISK REWARD-1.3)
- **QUITE BREAKOUT POSSIBLE
**** BUY-750
9o SL-740
TARGET-800
**-Trade Analysis- macd and rsi 50 are quite break out ** (slow movements of buying, don't pennic, le

Hinduja Global - trend reversal???Hello 👋
It's a IT - software industry stock.
* Trend reversal can be started.
* Currently price is in demand zone from where it was long run previously.
* Strong volumes &; momentum inclined
* Double bottom pattern - weekly chart
* Stiff trendline..if break decisively above 1055 & sustain then

HindujaGlobalSol BullishOn weekly time frame it formed Bullish Harmonic Pattern and as per Supply Demand zones it has taken support on demand zone, as per Liquidation concept it has triggered Stoploss of previous swing lows and caputured liquidity and formed a base expecting a bull move just a view not a reco....

HGS SHOULD FLY FROM HERE?!NSE:HGS Analysis:
1/ Fantastic Results: CMP 827.5, with support at 800 and 750.
2/ Upside Targets:
- 899
- 985
- 1080
3/ Trendline Breakout: Above 1085 closing, targets:
- 1175
- 1280
- 1425
- 1570
- 1705
- 1970
4/ Fresh View: Reevaluate above 2000 closing.

HGS - Weekly AnalysisIn the Weekly Chart of HGS ,
we can see that; it has shown a recovery sign from 720 levels.
Now it has created a Halt candle.
Enter on breaking its high with low as SL.

HGSHGS at its Major Support & Looking good for Longterm if make some Base formation & sing to reversal we can see such a good targets in Upcoming Days

See all ideas
Summarizing what the indicators are suggesting.
Oscillators
Neutral
SellBuy
Strong sellStrong buy
Strong sellSellNeutralBuyStrong buy
Oscillators
Neutral
SellBuy
Strong sellStrong buy
Strong sellSellNeutralBuyStrong buy
Summary
Neutral
SellBuy
Strong sellStrong buy
Strong sellSellNeutralBuyStrong buy
Summary
Neutral
SellBuy
Strong sellStrong buy
Strong sellSellNeutralBuyStrong buy
Summary
Neutral
SellBuy
Strong sellStrong buy
Strong sellSellNeutralBuyStrong buy
Moving Averages
Neutral
SellBuy
Strong sellStrong buy
Strong sellSellNeutralBuyStrong buy
Moving Averages
Neutral
SellBuy
Strong sellStrong buy
Strong sellSellNeutralBuyStrong buy
Displays a symbol's price movements over previous years to identify recurring trends.
Frequently Asked Questions
The current price of HGS is 401.00 INR — it has decreased by −0.25% in the past 24 hours. Watch Hinduja Global Solutions Limited stock price performance more closely on the chart.
Depending on the exchange, the stock ticker may vary. For instance, on NSE exchange Hinduja Global Solutions Limited stocks are traded under the ticker HGS.
HGS stock has fallen by −5.39% compared to the previous week, the month change is a −6.50% fall, over the last year Hinduja Global Solutions Limited has showed a −29.03% decrease.
HGS stock is 2.15% volatile and has beta coefficient of 1.32. Track Hinduja Global Solutions Limited stock price on the chart and check out the list of the most volatile stocks — is Hinduja Global Solutions Limited there?
Today Hinduja Global Solutions Limited has the market capitalization of 18.92 B, it has increased by 3.15% over the last week.
Yes, you can track Hinduja Global Solutions Limited financials in yearly and quarterly reports right on TradingView.
HGS net income for the last quarter is 425.90 M INR, while the quarter before that showed −195.30 M INR of net income which accounts for 318.07% change. Track more Hinduja Global Solutions Limited financial stats to get the full picture.
Yes, HGS dividends are paid annually. The last dividend per share was 7.00 INR. As of today, Dividend Yield (TTM)% is 1.72%. Tracking Hinduja Global Solutions Limited dividends might help you take more informed decisions.
Hinduja Global Solutions Limited dividend yield was 0.00% in 2024, and payout ratio reached 0.00%. The year before the numbers were 0.95% and 25.05% correspondingly. See high-dividend stocks and find more opportunities for your portfolio.
As of Feb 17, 2026, the company has 11.93 K employees. See our rating of the largest employees — is Hinduja Global Solutions Limited on this list?
EBITDA measures a company's operating performance, its growth signifies an improvement in the efficiency of a company. Hinduja Global Solutions Limited EBITDA is 2.14 B INR, and current EBITDA margin is 5.94%. See more stats in Hinduja Global Solutions Limited financial statements.
Like other stocks, HGS shares are traded on stock exchanges, e.g. Nasdaq, Nyse, Euronext, and the easiest way to buy them is through an online stock broker. To do this, you need to open an account and follow a broker's procedures, then start trading. You can trade Hinduja Global Solutions Limited stock right from TradingView charts — choose your broker and connect to your account.
Investing in stocks requires a comprehensive research: you should carefully study all the available data, e.g. company's financials, related news, and its technical analysis. So Hinduja Global Solutions Limited technincal analysis shows the strong sell today, and its 1 week rating is sell. Since market conditions are prone to changes, it's worth looking a bit further into the future — according to the 1 month rating Hinduja Global Solutions Limited stock shows the strong sell signal. See more of Hinduja Global Solutions Limited technicals for a more comprehensive analysis.
If you're still not sure, try looking for inspiration in our curated watchlists.
If you're still not sure, try looking for inspiration in our curated watchlists.