Hindustan unilever longHindustan unilever formed bullish divergence on charts and explained on chart
Trade ideas

HINDUNILVR buy @ 2480"Delivery Idea 18-09-23
HINDUNILVR (CMP: 2483.95)
Buy Price: 2480
SL Below: 2415
Target: 2730"
Stock has Start moving after going RSI below 30 and CCI below 200.
Also find Inverted Hammer in Hourly Candle.

HINDUNILVR HULThis FMCG giant is consolidating in the range of 2428-2723 from a long time. It is near the support levels. If there is a close below 2428, there can be a new downside in this counter. But if it sustains 2428 on closing basis then we may see 2723 again
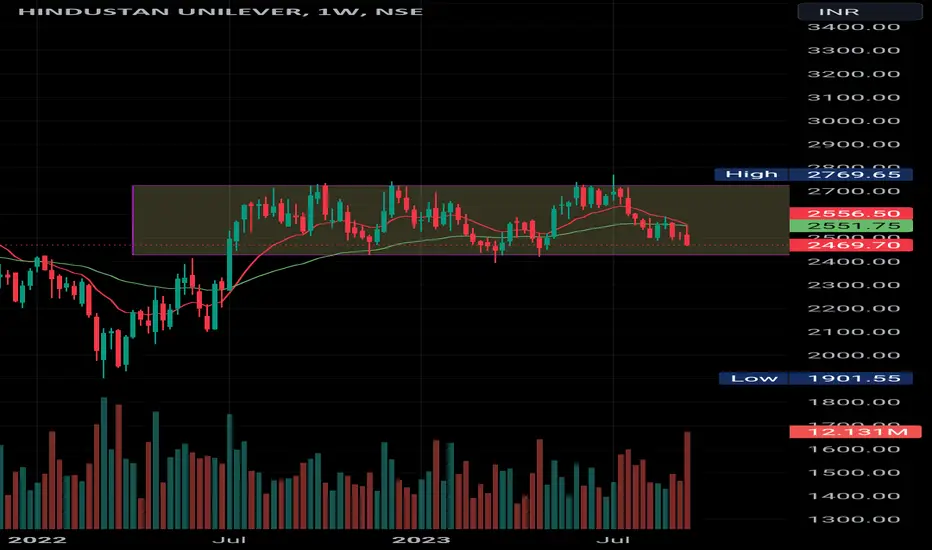
Sideways pattern The horizontal price movement that occurs when the forces of supply and demand are nearly equal.
Stock : Hindunilvr
Time frame : weekly
refer chart for details

HINDUNILVR DAILYLOOKS GOOD.
Hindustan Unilever Limited (HUL) is a British-owned Indian consumer goods company headquartered in Mumbai. It is a subsidiary of the British company Unilever. Its products include foods, beverages, cleaning agents, personal care products, water purifiers and other fast-moving consumer goods (FMCGs).
ONLY FOR EDUCATIONAL PURPOSE.

#Hindunilver cash : Looks good above 2550.10#Hindunilver cash -Positional call
11.09.2023
Looks good above 2550.10
Stoplos 2530
Tgt 2574/2596/2640
Cmp 2536.25

HINDUNILVR - Weekly AnalysisIn the Weekly Chart of HINDUNILVR ,
we can see that, it has multiple rejections at 2700-2730 levels.
It has now created a Halt Candle.
We might see a W pattern breakout in it.
If it breaks, enter on breaking its high with low as SL.

Hindunilvr: Opportunity to buy on dips; TG: 3388; SL: 2176
The stock is in 3rd wave of the quarterly time frame. The daily close of 01-Sep-23 was 2504.8 which is in the monthly demand zone 2513.15 to 2373.6. It is an Opportunity to buy on dips; TG: 3388; SL: 2176

Hindustan Unilever WeakHind Unilever Larger View :
FMCG index has turned BIG RED.
Hyper Inflation will lead to less demand.
Sell At Cmp 2565.85
Sell On Rise To 2627-2630
SL - 2680 ( DCB )
Target - 2400
Below 2400 Vertical Fall To 1900

HINDUNILVR is showing higher highs for some daysNSE:HINDUNILVR showing signs of respecting support of 2500.

Hindustan Unilever
Hindustan Unilever Limited is a British-owned Indian consumer goods company headquartered in Mumbai. It is a subsidiary of the British company Unilever. Its products include foods, beverages, cleaning agents, personal care products, water purifiers and other fast-moving consumer goods.

HUL- Demand zoneHUL has hit a proximal line of weekly demand zone so we could see a good bullish move even on a day where Nifty has lost 150 points so that suggests the levels are good.
Disclaimer: this is my view please take your decisions on your analysis.

HIndustan UniliverIn Hindustan Unilever it is time to buy, the one who understands the risk and report, he is successful in the market.

unilever - buy for a bounceBuy from cmp to 2540
sl close below - 2537
easy tg - 2575
Disclaimer : This is my personal analysis for study purpose not intended for trading.


clear demand area one side move in hindunilvr . because few days stock take support and support and today my analysis for buying side if 5 mint clear days high then we go for buying side

Consider the Triangle HULTrading and investing in the financial markets carry a high level of risk. It is essential to carefully consider your financial situation, risk tolerance, and investment goals before making any trading or investment decisions. Always do your own research, seek professional guidance, and make informed decisions based on your own judgment.
Any opinions, analyses, charts, or other information shared in this post are based on 's personal experience, market observations, and interpretation of available data. They do not guarantee future results or accuracy. The financial markets are dynamic and subject to various factors that can impact price movements and market conditions.

hindustan uniliver cup&handle patternhindustan uniliver cup&handle pattern
Cup and handle bullish pattern after restest
Rocket after 2740 above closing only
2588 strong support
2521 rocket lunch level if come buy sure
2414 2165 support

HINDUNILVR - Weekly AnalysisIn the Weekly Chart of HINDUNILVR ,
we can see that; it has given multiple rejections at 2700-2720 levels.
It has formed a Hammer Candle on W pattern breakout Trendline.
Time for HINDUNILVR to show up move.
Enter at 5606 with SL as 2550 and target as at least 3000.

HINDUNILVR Pretty good for short. NSE:HINDUNILVR
This stock has been broken out of 74Days support.
Can be test new support levels.
Stock might move 1.5% from the entry price.
With SL of 0.7%
Educational purposes only.
Do your own analysis.
HINDUNILVR is looking weak and can show 2500 levelsNSE:HINDUNILVR is looking weak and making lower lows and can show 2500 levels if it does show any recovery.

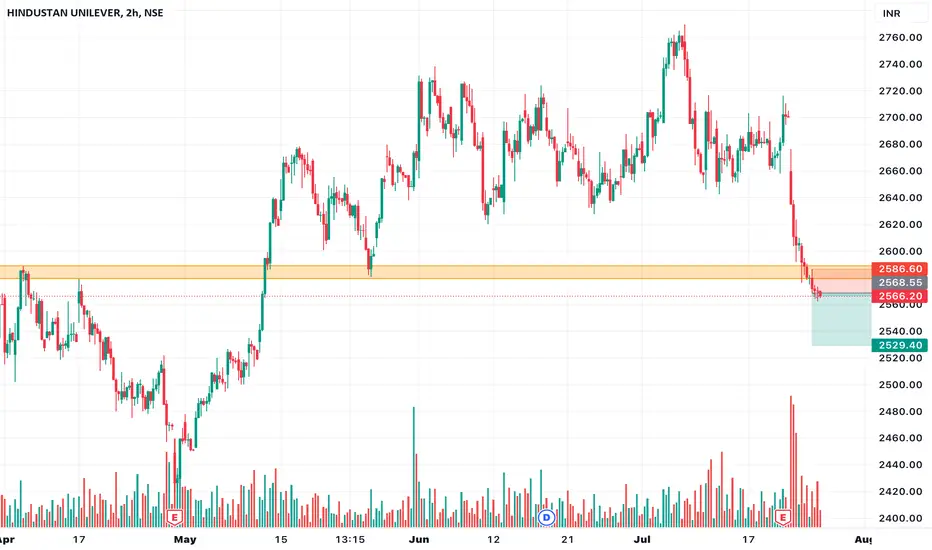
HINDUSTAN UNILEVER BREAKS DOWN AFTER POOR EARNING RESULTSTECHNICAL ANALYSIS :
ASCENDING RECTANGLE BREAKDOWN -
Price has broken down from the ascending rectangle pattern with confirmation
VOLUME SPIKE -
On 21st july, price has shown huge volume spike with the breakdown indicating strong downward momentum
50D SMA BREAKDOWN -
Price has broken out of the 50D sma after consolidating above it for a long time making it a very strong resistance zone
STRONG SUPPORT-RESISTANCE ZONE BREAKDOWN -
A very strong support-resistance zone level has been broken down by the price which had earlier acted as either strong support level or strong resistance level multiple times
OVERSOLD RSI -
Cherry on the cake is that rsi is oversold indicating very strong momentum behind the breakdown
FUNDAMENTAL ANALYSIS :
EARNING MISS -
On the jun'23 quarter HUL has missed its revenue forecast by ~2.5% & profit forecast by ~4% indicating poor performance by the company
STIFF COMPETITION -
The regional players who had left the market during peak inflation have returned as inflation subsides indicating even higher competition for company
MUTED DEMAND -
Company has said that the demand in rural areas has not yet picked up and consumers are still preferring unbranded alternatives compared to its Tea brand
TP - 2700
SL - 2560

HUL Analysis! W and Flag and Pole!HINDUSTAN UNILEVER ANALYSIS!
HUL Daily Analysis!
HUL Analysis with combination of Patterns and RSI!
Double Bottom Pattern Formation and Breakout in HUL!
Flag and Pole Pattern Formation and Breakout in HUL!
HUL has made Double Bottom pattern on daily timeframe it has given a breakout to the neck level and retested it's support level on the Neckline only. The interesting fact is, during it's retesting treading sessoins it has made Flag and Pole Pattern and also given a strong breakout. So we have combination of Patterns now with proper Breakouts and Retests. We can expect further upmove in HUL. Nifty also trending upwards.
Entry = Aggressive Investors can buy at current levels, Conservative investors can wait for small retest.
Stop Loss = Below 2577.65
Targets= 1) 2689.80 2) 2740.20 3) 2790.25 or 2827.35
Disclaimer = All my analysis are for Educational Purpose only. Before entering into any trade - 1) Educate Yourself 2) Do your own research and analysis 3) Define your Risk to Reward ratio 4) Don't trade with full capital
