Trade ideas

Hindustan Unilever - Daily CMP 2680Ascending triangle on weekly + inverse Head and shoulders on daily.
Best buy would be around 2600 levels.
Neckline at 2735.
Above neckline targets 2770-2820-2855
SL - closing below 2520

Will HINDUNILVR breakout Ascending Triangle Pattern ?Breakout of Ascending Triangle Pattern at 2720.
With Targets of 2825, 3000 & 3300.

HINDUNILVR* *For Study Purpose Only, Not a treading Idea * *
Hindustan Uniliver is forming Inverted Head & Shoulder Pattern (Bullish Pattern)
Ideal Entry will be 2720 and Target will be somewhere around 3000
*Save in your Watchlist*

Triangle breakout Tianage break out has come in 15 mins trend.
Target 2606
SL - low of the triangel
Entry - cmp


Hindustan Unilever : Trend FollowingNSE:HINDUNILVR
This line is acting as a trendline and gives major support to the stock.
Arrow marks in this chart indicate whenever the stock price has come closer to this level the price supported and bounced back.
Scenario 1:
Stock can take support at its trendline and continue to be in an uptrend which will make this trendline further stronger.
Scenario 2:
Stock can break down its trendline and continue to be in a downtrend for some more time.
This post is for educational purposes and not any recommendation. Kindly do your research or take help from a financial advisor before taking any investment decision.
Mr_Financial_Literate

H&S pattern in HINDUNILVR ???!!!!Chart depicts the situation...
Strong DOJI candle on 9th december(day candle) with volume at perfect resistance level shows some sort of lag in bulls approach, which may leave space for bears to get back to go through a down swing move inside the triangular primary channel.(clearly seen in weekly time frame)
Now, coming to 2hr time frame,
1. Head and Shoulders pattern (right shoulder in progress..)
2. Entry can be after breakdown after the right shoulder.
3. Risky entry can be now....with a SL ON 2HR CANDLE CLOSING ABOVE 2721.
4. Target levels as mentioned in chart.
Let's wait and watch ...how it moves...!!!
Note- just sharing my view....not a tip nor advice!!!

Potential Breakout in HUL - Catching it earlyNSE:HINDUNILVR
Potential breakout occuring in Hindustan Unilever
Broad based buying seen across consumer stocks. (Check Dabur, Godrej CP). Trading above key MAs, trying to break above resistance zone.
Already broken above previous high, good volume activity. Can be a good long trade.
Target R1 / R2 based on monthly pivots, the R:R stands at 1:1 and 1:2 respectively, with an SL coming below today's low.


[POSITIONAL] HINDUNILVR LONG BET risk: Reward ratio is 1: 2
Rest as per Charts
********
Note -
One of the best forms of Price Action is to not try to predict at all. Instead of that, ACT on the price. So, this chart tells “where” to act in “what direction. Unless it triggers, like, let’s say the candle doesn’t break the level which says “Buy/Sell if it breaks”, You should not buy/sell at all.
=======
I use shorthands for my trades.
“Positional” - means You can carry these positions and I do not see sharp volatility ahead.
“Intraday” -means You must close this position at any cost by the end of the day.
=======
Always follow a stop loss.
In the case of Intraday trades, it is mostly the “Low/High of the Candle”.
In the case of Positional trades, it is mostly the previous swings
********

HUL good to watchNSE:HINDUNILVR
Good to keep on the radar
Always respect SL & position sizing
========================
Trade Secrets By Pratik
========================
Disclaimer
SEBI UNREGISTERED
This is our personal view and this analysis
is only for educational purposes
Please consult your advisor before
investing or trading
You are solely responsible for any decisions
you take on basis of our research.

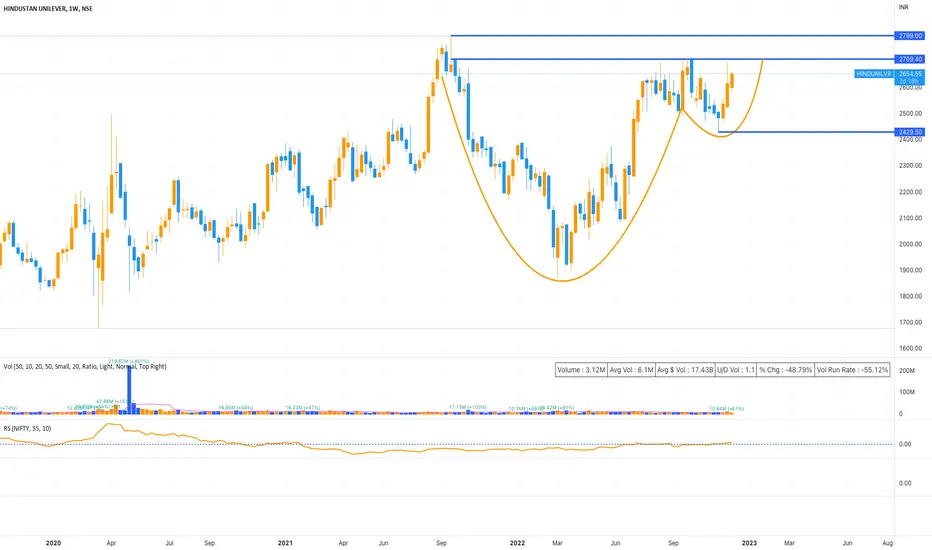
HUL-Move upto 3400 levels HUL is forming cup and handle pattern on weekly time frame. Can move towards 3100 and if sustained, can move towards 3400 levels.
HINDUNILVR | Trade on channel
• At the Channel Resistance .
• So from here expecting Breakout of channel or continuation of channel . we are ready for both .
• Entry :-
Upside Entry on break 2560
Upside Entry on break 2518.20
• Upside Resistances can become our targets.
Targets :- 2628.45
• Downside Supports can become our targets.
Targets :- 2453.95 , 2428.10
• Stop Loss / SL :-
for upside 2518.20 Support zone .
for downside 2560 Resistance zone .

HINDU UNILEVER - looking good in both side#HINDUNILEVER ...
INTRADAY/ Short term delivery call as well
All levels given in charts ...
BOTH SIDES OPEN
IF good potential seen then we work in options also
if activate then possible a huge movement Keep eye on this ...
We take trade only when it activates...
Possible to give good target

HINDUNILEVELR HEADING TOWARDS 2747.Sectoral rotation taking place.
Today was the day for FMCG sector.
most of the stocks has break out.
It seems hindunilvr is heading towards more than 2700 in near future.
My recents posts are attached here with.

Bullish flag pattern breakout in HINDUNILVRHINDUNILVR
Key highlights: 💡⚡
📊On 1D Time Frame Stock Showing Breakout of Bullish flag Pattern.
📊 Strong Bullish Candlestick Form on this timeframe.
📊It can give movement up to the Breakout target of above 3070+.
📊Can Go Long in this stock by placing a stop loss below 2520-.
📊 breakout this can give risk:reward upto 1:13+.

Unilever : Wedge Breakout + Support of EMA 200Earlier Unilever has given the Head & Shoulder breakout and after the breakout, the price moved upward by 10% and retrenched to level of Rs 2440 i.e. that was a H&S neckline & EMA 200 resistance level earlier, now acting as support.
Today's candle given a wedge breakout and price closed above EMA 21, opportunity to enter into trade with risk and reward of 1:2
The entry, target mentioned in chart and stop loss as per R&R ratio.
Thanks
-AJ

HindUniliver - Classic Cup & Handle PatternAlso this recommendation/presentation and all future ones are & will be only for learning purpose.
Please consult your financial advisor before investing.
Thank you.

Hindustan Unilever Cup and handle formed in hul
Intraday trade we can enter this trade
Entry :2500
Target :2550
SL : 2485
#dyor

Hul longAt support , with hugh delivery margin of 70 percent for last one week . It may bounce back to 2640 level

HUL longAt good support level , with delivery margin of above 70 for past one week . It may bounch back to 2650 level

