hindustan unilive revised target for buy is 2020**Hindustan Unilever Limited (HUL)** is India’s largest **FMCG (Fast-Moving Consumer Goods)** company, producing a wide range of daily-use consumer products. It is a subsidiary of **Unilever**, a global consumer goods giant.
---
### **Key Facts About HUL:**
- **Founded:** 1933 (as Hindustan Vanaspati Manufacturing Co.)
- **Headquarters:** Mumbai, India
- **CEO & MD:** Rohit Jawa (as of recent updates)
- **Parent Company:** Unilever (owns ~62% of HUL)
- **Revenue:** Over **₹60,000 crore** (varies yearly)
- **Stock Listing:** **NSE & BSE** (Ticker: **HINDUNILVR**)
- **Market Cap:** Among India's top FMCG companies (₹6+ lakh crore)
---
### **Major Business Segments & Brands:**
#### **1. Home Care**
- **Detergents:** Surf Excel, Rin, Wheel
- **Dishwash:** Vim
- **Purifiers:** Pureit
#### **2. Beauty & Personal Care**
- **Soaps & Body Wash:** Lux, Dove, Pears, Lifebuoy
- **Shampoos & Conditioners:** Clinic Plus, Sunsilk, TRESemmé
- **Oral Care:** Pepsodent, Close-Up
- **Skincare & Cosmetics:** Fair & Lovely (now Glow & Lovely), Ponds, Lakmé
#### **3. Foods & Beverages**
- **Tea & Coffee:** Brooke Bond Red Label, Lipton, Taaza, Bru
- **Health Drinks:** Horlicks, Boost (acquired from GSK Consumer)
- **Ketchup & Soups:** Kissan, Knorr
- **Ice Creams:** Kwality Wall’s, Magnum
---
### **Sustainability & Digital Expansion**
- **Plastic-free packaging & carbon neutrality** goals.
- **E-commerce & digital sales growing rapidly** (partnerships with JioMart, Amazon, Flipkart).
---
### **Competitors:**
- **FMCG Giants:** ITC, Nestlé India, Dabur, Patanjali, P&G, Marico
- **Retail & E-commerce:** Reliance Retail, Amazon, Flipkart
HUL dominates the **consumer goods** sector with strong brands across **personal care, home care, and food & beverages**. Are you looking for **financial details, market trends, or stock insights**? 🚀
Trade ideas

Hindustan Unilever Ltd. (HUL) Stock Analysis### **Hindustan Unilever Ltd. (HUL) Stock Analysis**
---
#### **Fundamental Analysis:**
- **Company Overview:**
Hindustan Unilever Ltd. (HUL) is one of India’s largest consumer goods companies, operating in diverse sectors such as home care, personal care, foods, refreshments, and health & wellness. It is a subsidiary of Unilever, one of the world's leading suppliers of food, beverages, and consumer products.
- **Revenue & Profit Growth:**
- HUL has consistently delivered stable revenue and profit growth, supported by a strong brand portfolio and distribution network. For Q3 FY2025, the company reported a 13% YoY growth in net profit, totaling ₹2,200 crore.
- The company’s revenue growth is driven by its dominant presence in the Indian market across categories like personal care (Dove, Lux), home care (Surf Excel, Rin), and foods (Knorr, Lipton).
- **Valuation (as of Feb 2025):**
- **P/E Ratio:** 60.5 (higher than the industry average, reflecting premium valuations due to consistent growth and market leadership)
- **Price-to-Book Ratio:** 16.5 (indicating strong market expectations for long-term growth)
- **Dividend Yield:** 1.2% (the company has a robust dividend payout track record)
- **Key Ratios:**
- **Return on Equity (ROE):** 90% (indicating exceptional return on shareholders' equity, a testament to HUL’s efficient operations)
- **Return on Assets (ROA):** 27% (shows the company’s effectiveness in utilizing its assets to generate profit)
- **Debt-to-Equity Ratio:** 0.15 (low leverage, indicating HUL’s strong balance sheet and ability to generate growth without relying heavily on debt)
- **Outlook:**
HUL has maintained its leadership position in the Indian consumer goods market. Its diversified product range, strong brand equity, and extensive distribution network position it well for long-term growth. However, its high valuation relative to the broader market may limit upside potential in the near term. Investors should monitor input costs (e.g., raw materials) and demand fluctuations in key sectors, such as personal care and home care.
---
#### **Technical Analysis:**
- **Current Price:** ₹2,830 (as of February 2025)
- **Chart Overview:**
HUL has been in a strong uptrend for the past several years, with a history of consistent positive performance. It recently faced some resistance near ₹2,880 but remains in an overall bullish trend, supported by strong institutional buying.
- **Support and Resistance Levels:**
- **Immediate Support:** ₹2,750 (a strong level where buying interest has historically emerged)
- **Next Major Support:** ₹2,600 (important long-term support level)
- **Immediate Resistance:** ₹2,880 (previous high, a breakout above this could trigger further upside)
- **Next Major Resistance:** ₹3,000 (psychologically significant level, if breached, could lead to significant upward movement)
- **Moving Averages:**
- **50-Day Moving Average (50-DMA):** ₹2,780 (indicating bullish sentiment in the short term)
- **200-Day Moving Average (200-DMA):** ₹2,500 (providing strong long-term support)
- **Relative Strength Index (RSI):**
- RSI stands at 70, indicating the stock is approaching overbought territory. This suggests that HUL may experience a short-term pullback or consolidation before further upward movement.
- **MACD:**
- The MACD has shown a bullish crossover, suggesting the continuation of the uptrend. However, with the RSI in the overbought zone, a short-term correction or consolidation may occur before the stock resumes its upward momentum.
---
#### **Key Metrics:**
- **Market Capitalization:** ₹6.4 lakh crore (approx.)
- **52-Week High:** ₹2,920
- **52-Week Low:** ₹2,250
---
#### **Risk Considerations:**
- **Valuation Risk:** The stock’s high P/E ratio suggests that it is trading at a premium compared to the market, and any slowdown in growth could result in a correction.
- **Commodity Price Risks:** As a major player in the FMCG sector, HUL is sensitive to fluctuations in raw material costs, such as palm oil and other agricultural commodities. Increases in these costs could compress margins.
- **Competition:** The FMCG sector is highly competitive, with numerous global and local players vying for market share. While HUL has a strong brand portfolio, increasing competition from both traditional and emerging brands can put pressure on margins and market share.
- **Regulatory Risks:** Changes in government policies related to taxes, regulations, or consumer preferences could impact HUL’s business.
---
### **Conclusion:**
Hindustan Unilever remains one of the most reliable stocks in the Indian FMCG sector, offering strong financial performance, consistent growth, and robust market leadership. The stock is currently trading at a premium valuation, and while it continues to show growth, potential investors should be cautious of the high valuation risk. Technically, HUL is in a bullish trend with support at ₹2,750 and resistance at ₹2,880. However, given the overbought RSI, there could be short-term corrections, and investors should watch for a potential pullback before initiating fresh buys.
---
**Disclaimer:** This analysis is based on publicly available information, and I am not a SEBI-registered advisor. Please conduct your own research and consult a certified financial advisor before making any investment decisions. This is for informational purposes only and should not be considered as financial advice.

HINDUSTAN UNILEVER ON DEMAND ZONE 24/02/2025Symbol : HINDUNI , Exchange : NSE India , Timeframe : Daily Today HINDUNI IN Demand zone
Bothe side Move be possible

what is pivot points and why it super useful ?**Pivot points** are key technical indicators used by traders to identify potential support and resistance levels in the market. They are widely used in various markets, such as stocks, forex, and futures, to help traders determine the overall market trend and make decisions about entry, exit, and stop-loss levels.
### What are Pivot Points?
Pivot points are calculated using the **high**, **low**, and **closing prices** from the previous trading period (day, week, or month). These calculations create a set of price levels, including the main **pivot point (P)** and several support and resistance levels (S1, S2, S3 for support, and R1, R2, R3 for resistance).
### Basic Calculation of Pivot Points:
1. **Pivot Point (P)**:
\
2. **Support and Resistance Levels**:
- **First Support (S1)** = (2 × P) - High
- **First Resistance (R1)** = (2 × P) - Low
- **Second Support (S2)** = P - (High - Low)
- **Second Resistance (R2)** = P + (High - Low)
- **Third Support (S3)** = Low - 2 × (High - P)
- **Third Resistance (R3)** = High + 2 × (P - Low)
These calculations give you the **pivot point** (the most likely level of price equilibrium), **support levels** (prices where the market could find buying interest), and **resistance levels** (prices where the market might face selling pressure).
### Why Pivot Points are Super Useful
1. **Key Support and Resistance Levels**
Pivot points provide traders with important levels where prices are likely to encounter support or resistance. These levels are critical for making trading decisions, including:
- **Entry Points**: Traders can use pivot points to identify entry points. If the price is near support and shows signs of reversal, traders might buy, expecting the price to bounce back.
- **Exit Points**: Conversely, if the price approaches resistance and shows signs of weakness, traders may decide to sell or exit positions.
2. **Identifying Market Trend**
Pivot points are especially useful for determining the **market trend**:
- **Bullish Market**: If the price is trading above the pivot point, it generally indicates a bullish market, and traders may look for buying opportunities.
- **Bearish Market**: If the price is trading below the pivot point, it generally indicates a bearish market, and traders may look for selling opportunities.
- **Neutral Market**: If the price is hovering around the pivot point, it suggests indecision, and traders may wait for a breakout in either direction before making a move.
3. **Quick and Easy Calculation**
Pivot points are easy to calculate and do not require complex tools or software. This makes them accessible for both beginner and experienced traders. Many trading platforms automatically calculate pivot points, so traders can focus on trading rather than complex math.
4. **Helps with Risk Management**
By using pivot points, traders can set stop-loss and take-profit levels more effectively. For instance, if the price reaches a resistance level (R1, R2, R3), it might be wise to set a **take-profit order** near that level. Similarly, if the price is approaching a support level (S1, S2, S3), a trader might decide to place a **stop-loss** just below the support level to minimize losses in case the market moves against them.
5. **Flexibility Across Timeframes**
Pivot points are versatile and can be used on different timeframes—whether you're a **day trader**, **swing trader**, or even a **position trader**. Pivot points help traders with a wide range of trading strategies by identifying critical price levels in both short-term and long-term markets.
6. **Can Be Combined with Other Indicators**
Pivot points work well in combination with other technical analysis tools, such as moving averages, RSI (Relative Strength Index), MACD (Moving Average Convergence Divergence), or candlestick patterns. This combination increases the probability of identifying the right entry and exit points.
7. **Self-fulfilling Prophecy**
Pivot points are widely used by many traders, which means that many market participants pay attention to the same levels. As a result, these levels often become **self-fulfilling prophecies**—meaning that the price will often react to these levels because many traders are placing orders around these points.
8. **Intraday and Long-Term Analysis**
- **Intraday Trading**: For day traders, pivot points are especially useful for identifying **intraday trends** and potential turning points. They help traders decide when to enter or exit trades based on short-term market movement.
- **Long-Term Trends**: Pivot points can also be used in longer timeframes (weekly or monthly) to identify broader market trends and significant reversal zones.
9. **Price Targets**
Pivot points can also be used to set realistic price targets. For example, if the market is above the pivot point, traders might look to target resistance levels (R1, R2, R3) as potential profit-taking levels. Conversely, if the market is below the pivot point, support levels (S1, S2, S3) may be key targets for the downside.
---
### Example of How to Use Pivot Points in Trading:
Let’s assume you’re trading a stock, and you’ve calculated the pivot points for the day based on the previous day’s high, low, and close. Here’s how you might use them:
1. **Price Trading Above Pivot Point**:
If the stock is trading above the pivot point, you might consider it to be in an uptrend. You could look for **buying opportunities** at or near the pivot point (P) or at **support levels (S1, S2, etc.)**.
2. **Price Trading Below Pivot Point**:
If the stock is trading below the pivot point, it could indicate a downtrend. You might then look for **selling opportunities** at or near the pivot point or at **resistance levels (R1, R2, etc.)**.
3. **Price Reversing Near Support/Resistance**:
If the price approaches a significant support or resistance level (S1, R1, etc.) and shows signs of reversal, you could enter a **trade in the opposite direction**, expecting the price to bounce or reverse.
4. **Breakouts**:
If the price breaks above a key resistance level (R1, R2, or R3), it could signal a continuation of the uptrend. Similarly, if the price breaks below a key support level (S1, S2, or S3), it might signal a continuation of the downtrend.
---
### Conclusion:
Pivot points are incredibly useful tools for identifying key support and resistance levels, understanding market sentiment, and making informed trading decisions. They are simple to calculate and apply, flexible across different timeframes, and work well when combined with other indicators. By integrating pivot points into your trading strategy, you can better manage risk, set realistic targets, and ride with the market trend, all of which can significantly enhance your overall trading success.

Hindustan UnileverHello & welcome to this analysis
FMCG sector appears to be doing better then other sectors after a very long time with Hindustan Unilever having a large weightage in the sector
Strength signal -
Since 2008 it has never violated the Quarterly Ichimoku Base line nor the Monthly Ichimoku Cloud. Near these support levels it becomes a very attractive value buy. This time also in 2024 it did the same.
After giving a Cup & Handle breakout in the weekly time frame its seen a pullback since October 2024 along with the rest of the market. In the last 3 weeks its gone sideways whereas we have seen other sectors continue to see sharp selling. Once again highlighting that current level is seeing consistent buying support. The pullback appears to have been completed as it bounced back from its rising trend line.
A daily falling wedge breakout has also witnessed a pullback now. As long as it now holds the rising trendline at 2350 it has good potential for upside suggesting a decent low risk high reward set up from short to medium term.
Upside levels one can look out for above 2400 are at 2700 / 3100 / 3300 / 3600
All the best for your trading and investing
My last video on the stock link is shared

HUL- This elephant may danceHUL was trading in a channel shown in chart for last 3 months. It recently showed a breakout from this channel. Current pattern shows retest of the channel. If this is successful, we may see HUL scaling new heights.
Recent budget announcements are in a way beneficial for FMCG sector.
You can keep it in watchlist. If it sustains above channel, investors can buy it with a stoploss at lower end of channel.
This is not a buy/sell recommendation.
This post is only for educational purpose.
Kindly consult your financial advisor before investing.
Use strict stoploss and money management rules.
Happy Trading!!

HUL wait for Pull back and then EnterHUL has just completed the downward Impluse and complex correction (W-X-Y). Although today it showed the strength to move upward, however it looks like there is need for one pullback before the upward Journey.
Chart Speaks everything.
Disclaimer: I am not SEBI registered member, these Ideas meant to be only for Educational Purposes.

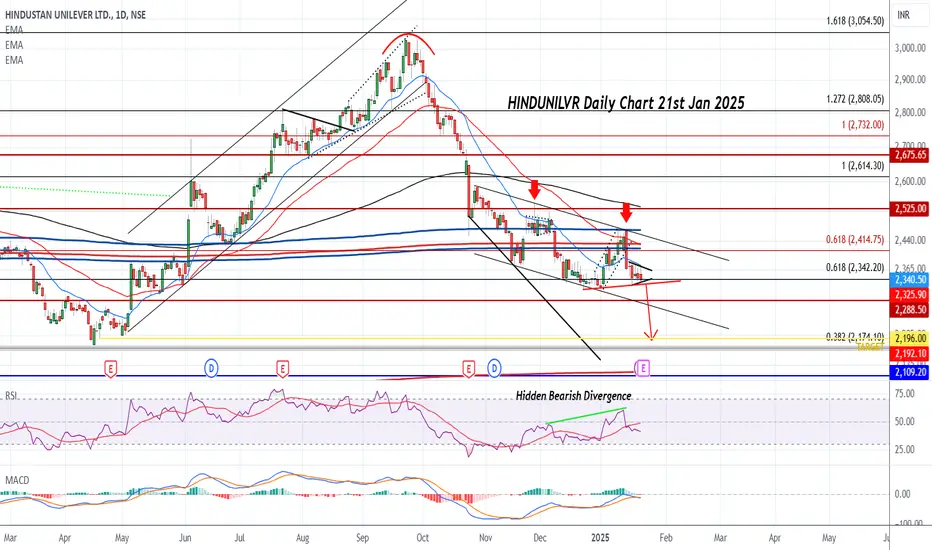
HINDUNILVR can DUMP on Earnings tomorrowAttached: Daily Chart as of 21st Jan 2025
Hidden Bearish RSI Divergence
MACD in Sell and below Zero line
Earnings tomorrow for HUL, if we go by Zomato Earnings which showed Slowdown and Weak Demand for Consumption then Earnings for HUL should also be similar
Price can Crash to Target 2200 and below levels
HUL: Bullish Setup Near Order Block!Order Block at Support:
The price is trading within a marked order block zone (₹2,260–₹2,326), which historically acted as a strong demand area.
This zone aligns with the upward-sloping green trendline, reinforcing support strength.
Bullish Falling Wedge: (Similar to 3 Drive Pattern)
A falling wedge pattern is visible, typically signaling a potential bullish breakout.
The price is currently testing the upper trendline of the wedge.
RSI Trendline Support:
RSI shows a bullish divergence with higher lows while the price forms lower lows.
RSI trendline is intact, indicating strengthening bullish momentum.
Confirmation Checklist:
Ensure a breakout above ₹2,387 with strong volume.
Monitor RSI to stay above 50 for continued bullish momentum.
Look for bullish pattern in minor timeframe for perfect entry and Stop Loss

HUL Accumulate at Below VWAP This is an Opportunity to buy GoodHindustan Unilever Limited (HUL) is India's largest fast-moving consumer goods (FMCG) company, with a rich heritage spanning over 90 years. Headquartered in Mumbai, Maharashtra, HUL is a majority-owned subsidiary of Unilever, one of the world's leading suppliers of food, home care, personal care, and refreshment products, operating in over 190 countries.
**Product Portfolio:**
HUL boasts a diverse portfolio of over 50 brands across 16 categories, including:
- **Home Care:** Brands like Surf Excel, Rin, and Wheel.
- **Beauty & Personal Care:** Brands such as Lux, Lifebuoy, Dove, Clinic Plus, Sunsilk, and Lakmé.
- **Foods & Refreshments:** Brands including Brooke Bond, Bru, Knorr, Kissan, and Kwality Wall's.
These brands are household names in India, with a significant presence in urban and rural markets.
**Financial Performance:**
For the fiscal year ending March 31, 2024, HUL reported a turnover of ₹59,579 crore.
**Leadership:**
As of January 2025, Sanjiv Mehta serves as the Chairman and Managing Director of HUL. Under his leadership, HUL has seen substantial growth, with its market capitalization increasing from $17 billion to over $70 billion in seven years, making it one of India's most valuable companies.
**Sustainability and Corporate Social Responsibility:**
HUL is committed to sustainable and responsible business practices. Through the Hindustan Unilever Foundation and its community partners, the company has created water potential of more than 1.3 trillion litres by democratizing water management in villages across India. Additionally, the Shakti program has empowered over 136,000 women entrepreneurs in rural India. HUL's health and hygiene initiatives have impacted more than 154 million people nationwide.
**Recent Developments:**
In January 2025, HUL's Doom Dooma Factory in Assam was declared an end-to-end value chain lighthouse by the World Economic Forum, recognizing its advanced use of technologies such as artificial intelligence and machine learning to drive productivity and sustainability.
With a strong legacy, diverse product portfolio, and commitment to sustainability, Hindustan Unilever Limited continues to be a leader in India's FMCG sector, delivering quality products to consumers across the nation.

Hindustan Unilever Ltd Shar Analysis Part 2Hindustan Unilever Limited (HUL) is one of India's largest and most prominent fast-moving consumer goods (FMCG) companies. It is a subsidiary of the British-Dutch multinational consumer goods company Unilever. Established in 1933, HUL's product portfolio spans categories such as home care, personal care, food and beverages, and health and wellness.
### Key Aspects of Hindustan Unilever:
1. **Product Portfolio**: HUL offers a wide range of products including popular brands like Surf Excel, Dove, Lipton, Bru, Lifebuoy, and TRESemmé.
2. **Headquarters**: Located in Mumbai, India.
3. **Revenue and Market Leadership**: HUL is a market leader in the FMCG sector in India, with a significant share across its product segments.
4. **Sustainability**: The company focuses on sustainable practices, including water conservation, waste management, and reducing carbon emissions.
5. **Innovation and Growth**: HUL continuously innovates and adapts to changing consumer preferences, driving growth with a mix of premium and mass-market products.
6. **Corporate Social Responsibility**: The company is also involved in numerous social initiatives, focusing on areas like health, hygiene, education, and women's empowerment.
HUL is a key player in India's economy, contributing significantly to employment and socio-economic development.

how to use crisis for investment..to gain multifold returnshello every one,
this video is with respect to how to utilize the crisis in different
sectors to invest, this helps in generating multifold returns
i have explained in the video regarding past crisis and their returns
and some current sectors suffering from crisis which can be utilized for investment
in a staggered way. video is a bit big but please watch full to gain immense knowledge.

Hindustan Unilever Limited (HUL) Analysis### Hindustan Unilever Limited (HUL) - Company Profile
**Overview:**
Hindustan Unilever Limited (HUL) is one of India's largest and most renowned fast-moving consumer goods (FMCG) companies. Established in 1933, HUL is a subsidiary of the British-Dutch multinational Unilever. HUL is headquartered in Mumbai, India, and has a diverse portfolio of products across various categories.
**Key Segments:**
1. **Home Care:** Products include fabric cleaners (Surf Excel, Rin), household cleaning products (Domex), and water purifiers (Pureit).
2. **Beauty & Personal Care:** This segment offers products such as soaps (Lux, Lifebuoy), shampoos (Sunsilk, Dove), skin care (Fair & Lovely, Vaseline), and oral care (Pepsodent, Closeup).
3. **Foods & Refreshments:** Includes tea (Brooke Bond, Lipton), coffee (Bru), culinary products (Kissan, Knorr), and ice creams (Kwality Wall's).
**Market Presence:**
HUL has a strong market presence across India, with a wide distribution network reaching urban and rural areas. The company has been a leader in innovation, launching new products and variants regularly to cater to evolving consumer needs.
**Sustainability Initiatives:**
HUL is committed to sustainable practices, focusing on reducing its environmental footprint and improving social impact. The company runs several initiatives under the Unilever Sustainable Living Plan, aiming to improve health and well-being, reduce environmental impact, and enhance livelihoods.
**Financial Performance:**
HUL has consistently delivered strong financial performance, driven by its broad product portfolio, extensive market reach, and effective marketing strategies. It is listed on the Bombay Stock Exchange (BSE) and the National Stock Exchange (NSE) in India.
**Recognition:**
HUL has received numerous awards and accolades for its corporate governance, sustainability practices, and contribution to the Indian economy.
HUL's strategic initiatives and focus on innovation and sustainability have established it as a trusted brand among Indian consumers.

HUL Trend Breakout Now Time To Accumulate Some Qty **Hindustan Unilever Limited (HUL)** is one of the largest and most well-known consumer goods companies in India, and a subsidiary of the British multinational Unilever. Established in 1933, HUL is headquartered in Mumbai, Maharashtra, and operates across multiple segments, offering a wide range of products in various categories like food and beverages, personal care, home care, and health and wellness.
### **Key Facts and Overview:**
- **Full Name**: Hindustan Unilever Limited
- **Industry**: Consumer Goods (FMCG - Fast-Moving Consumer Goods)
- **Headquarters**: Mumbai, Maharashtra, India
- **Founded**: 1933 (as Hindustan Vanaspati Manufacturing Co.)
- **Parent Company**: Unilever (a global consumer goods giant)
- **Market Presence**: HUL is one of India's largest FMCG companies, with a vast distribution network across the country.
### **Business Segments:**
HUL operates across four key business segments:
1. **Home Care**: Includes products like detergents, cleaning agents, and air fresheners. Popular brands: Surf Excel, Rin, Domex, and Vim.
2. **Personal Care**: Encompasses products like skin care, hair care, deodorants, and oral care. Popular brands: Dove, Lux, Lifebuoy, Pond's, Sunsilk, and Close-Up.
3. **Food & Beverages**: Offers a range of packaged foods, beverages, and nutrition products. Popular brands: Brooke Bond, Lipton, Knorr, Kissan, and Hellmann's.
4. **Health & Wellness**: Includes products for hygiene, nutrition, and wellness. Notable brands: Horlicks (after acquisition), Pureit, and Vaseline.
### **Brands and Market Leadership:**
HUL owns some of India's most popular and trusted consumer brands, with a market leadership position in several segments. Some of its major brands include:
- **Dove** (personal care)
- **Lux** (personal care)
- **Lipton** (beverages)
- **Surf Excel** (detergents)
- **Brooke Bond** (tea)
- **Vaseline** (skin care)
- **Knorr** (food products)
### **Sustainability and Corporate Social Responsibility (CSR):**
HUL has been at the forefront of sustainability and CSR initiatives in India. The company is committed to achieving its sustainability goals through various initiatives such as:
- **Water Conservation**: HUL has invested in water-saving technologies and ensures that its production processes use water efficiently.
- **Waste Management**: The company works on reducing waste and increasing recycling rates.
- **Sustainable Sourcing**: HUL has committed to sourcing key ingredients like palm oil and tea in a sustainable manner.
- **Health and Nutrition**: With brands like Horlicks and Knorr, HUL has been focusing on promoting health and nutrition across India.
### **Financial Overview:**
HUL consistently ranks as one of the most profitable and valuable companies in India, driven by strong sales and market dominance. The company's revenue comes from a combination of domestic and international sales, with its operations in over 190 countries.
### **Leadership and Key Figures:**
- **Chairman**: Nitin Paranjpe
- **CEO**: Sanjiv Mehta
HUL is publicly listed on the Bombay Stock Exchange (BSE) and National Stock Exchange (NSE) in India. It is also one of the largest companies in terms of market capitalization in the Indian stock market.
### **Recent Developments:**
- HUL has actively pursued digital transformation, improving its e-commerce presence and supply chain efficiency.
- The company has also made strides in the health and nutrition segment through strategic acquisitions, including the purchase of Horlicks from GSK in 2020.
### **Global Influence and Partnerships:**
As part of Unilever, HUL benefits from global research, innovation, and shared sustainability practices, ensuring that the company remains competitive both locally and internationally.
### **Conclusion:**
Hindustan Unilever Limited stands as a leader in India's consumer goods sector, with a strong portfolio of brands across multiple categories. With a focus on sustainability, innovation, and social responsibility, it continues to be a dominant player in the FMCG industry, both in India and globally.

HINDUNILVR levelsAs of January 2, 2025, Hindustan Unilever Limited (HINDUNILVR) closed at ₹2,322.10 on the National Stock Exchange (NSE).
In the daily time frame, the stock exhibits the following support and resistance levels:
Support Levels:
Immediate Support: ₹2,312.73
Short-Term Support: ₹2,330.45
Medium-Term Support: ₹2,290.90
Long-Term Support: ₹2,266.30
Resistance Levels:
Immediate Resistance: ₹2,329.63
Short-Term Resistance: ₹2,355.05
Medium-Term Resistance: ₹2,394.60
Long-Term Resistance: ₹2,419.20
These levels are derived from technical analysis tools such as pivot points and moving averages.
It's important to note that the stock has been trading below key moving averages, indicating potential bearish momentum.
Investors should monitor these support and resistance levels closely, as they can provide insights into potential entry and exit points.
Disclaimer: This information is for educational purposes only and should not be construed as financial advice. Please consult with a financial advisor before making any investment decisions.

Long term Buy HINDUNILVRTechnically, Price of HINDUNILVR trading at good support of 2200 - 2300. In daily time frame there is a bullish divergence in RSI 14. IVR is more than 90, which is very rare.

HUL Bullish Monthly Demand Bounce OffLooks good to enter at the Monthly Demand 2300 with a target of 2700 within 3-4 months can go for it good entry and setup

HINDUNILVR at long term support/ buy zoneFundamentally, encircled are the areas to focus.
1st area of 2020-21, 2nd area of 2022 and third is 2024
Net profits have gone from 6756 to 10276 TTM from 2020. This suggests a TIME CORRECTION
Currently price came at lower line of those zones
Accumulation plan: Add quantities in downside
At 2300,
At 2245,
At 2180,
2110
2050
Holding period 3-5 years as it's bluchip

HINDUNILVRDistribution Schematic #1: wyckoff Phases
Stock has been struggling past 3 to breakout and sustain
one more last dead cat bounce is pending.

HUL for long term in correctionHUl is a quality company, but due to high inflation and slowdown in consumption it is going down.
As per weekly chart support lies near 2250 which is kind of close, start adding from 2340 to 2250 in sip mode.
Post budget with some good announcement consumption will pick up. keep sl at 1900 and go long for tgt 3000 ++
it is always advisable to add quality companies on dip this is the right dip for right company


Hindustan UnileverHindustan Unilever
Retested the zone today. Good to short
1.Entry at CMP
2.Target 1 - 2380
3.Target 2 - 2301
4.Stoploss - 2551

HINDUNILVR is holding a long term investment opportunityHINDUNILVR has taken support from its daily TF buying order block and has broken its structure on hourly time frame at 2485.45 and it is about to change its character at the level of 2516.95 and once it is successful in closing above 2545.95 it is not going to stop its bull run, it is a very good opportunity for the swing traders and long term investors to enter the rally and hold it for massive gains in long term.
